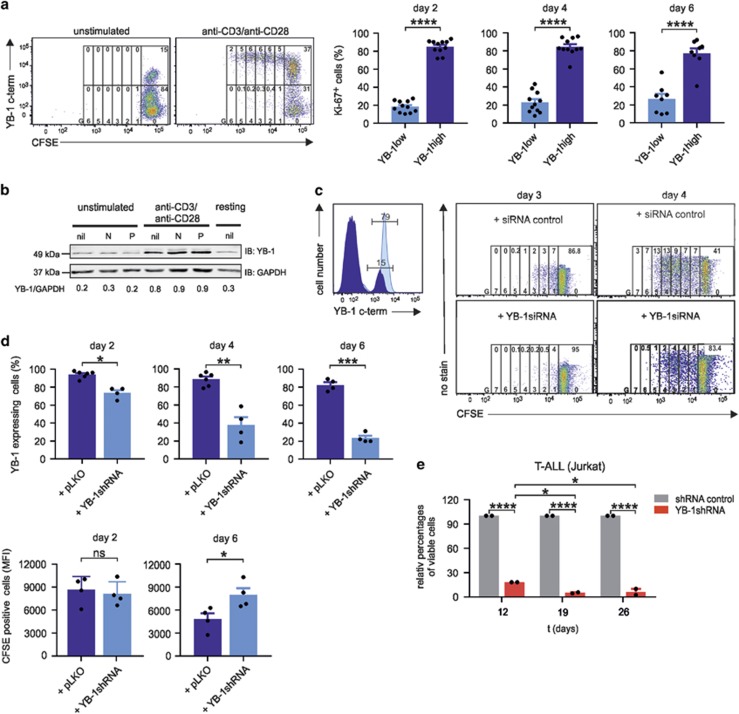
Figure 4.
A central role for YB-1 in T-cell proliferation. YB-1high is a prerequisite for proliferation of CD4+ T cells. (a) In all, 1 × 10⁶ primary human CD4+ T cells were labeled with carboxyfluorescein succinimidyl ester (CFSE) and cultured for 5 days in the absence or presence of anti-CD3/anti-CD28-coated beads. Co-staining of YB-1 allows discrimination of YB-1high from YB-1low-proliferating cells. Cells were further gated according to the number of cell divisions (G0–G6), and frequencies of undivided and divided YB-1high and YB-1low cells are indicated in the gates at the top of each generation. Representative data are shown from one out of two independent experiments. YB-1high-expressing T cells exhibit a high expression of the proliferation marker Ki-67. In all, 1 × 10⁶ primary human CD4+ T cells isolated from different donors (n=8–11) were stimulated with anti-CD3 and anti-CD28-coupled beads for specified time. Subsequently, T cells were fixed, permeabilized and co-stained using specific antibodies for YB-1 and Ki-67 followed by flow cytometric analysis. The illustrated graphs show the percentages of Ki-67-positive cells in YB-1high- and YB-1low-expressing CD4+ T cells on days 2, 4, and 6 after activation. The data are summarized using CD4+ T cells from 8 to 11 different donors. The mean value and S.E.M. are indicated, and for statistics, the two-tailed Student's t-test was applied *P<0.05, **P<0.01, ***P<0.001, ****P<0.0001. (b) YB-1 is already upregulated in G1 phase of the cell cycle. In all, 1 × 10⁷ CD4+ T cells from four different donors were either left unstimulated or stimulated with anti-CD3/anti-CD28-coupled beads for 24 h in the presence or absence of cell-cycle inhibitors Nocodazole (N; 100 nM) and Paclitaxel (P; 200 nM). Thirty micrograms of total cell lysates (proteins from four different donors were pooled) were prepared, and immunoblotting was performed as described before. GAPDH (glyceraldehyde 3-phosphate dehydrogenase) was used for internal normalization and relative intensities are shown below the blot. One representative example is shown out of two experiments. (c) Inactivation of YB-1 by specific small interfering RNA (siRNA) abrogates proliferation of CD4+ T cells. Also, 5 × 10⁶ CD4+ T cells were transfected with specific YB-1siRNA, and 72 h later, CD4+ T cells were fixed, permeabilized, stained, and analyzed by flow cytometry as described before. Left diagram shows the YB-1siRNA knockdown efficiency. The dark blue histogram represents CD4+ T cells transfected with YB-1siRNA, and light blue histogram shows CD4+ T cells transfected with control siRNA. Numbers indicate the percentages of YB-1-positive CD4+ T cells. Right panel shows CD4+ T cells labeled with CFSE. After transfections with YB-1siRNA or siRNA control, cells were activated using anti-CD3/anti-CD28 crosslinking and analyzed at the indicated time points by flow cytometry. Numbers on the top indicate frequencies of proliferating cells in each generation (G0–G7). (d) Inactivation of YB-1 in CD4+ T cells by viral transduction using specific YB-1shRNA. CD4+ T cells were transduced using measles virus system. CD4+ T cells were infected with measles virus carrying YB-1shRNA or control shRNA (short hairpin RNA). At specified time points, anti-CD3/anti-CD28-activated CD4+ T cells were fixed, permeabilized, stained, and analyzed by flow cytometry as described before. The top panel shows the knockdown efficiency in the percentage of cells either transduced with control vector or specific YB-1shRNA over specified time. The panel below demonstrates the average amounts of CFSE-positive CD4+ T cells analyzed by flow cytometry that were either transduced with YB-1shRNA or control shRNA, followed by activation using anti-CD3/anti-CD28 crosslinking for the indicated time points. Data summarized from four different experiments using CD4+ T cells. The mean value and S.E.M. are indicated, and for statistics, the two-tailed Student's t-test was applied. *P<0.05, **P<0.01, ***P<0.001. (e) Viable Jurkat cells after YB-1 inactivation detected by trypan blue staining. Jurkat cells were transduced with lentiviral particle containing YB-1shRNA (MOI 10) or control shRNA and a puromycin-resistance gene. On day 5, puromycin was added for selection. Viable cells were counted at the indicated time points. The data are summarized and normalized from three different experiments. The mean value and S.E.M. are indicated, and for statistics, analysis of variance was applied

