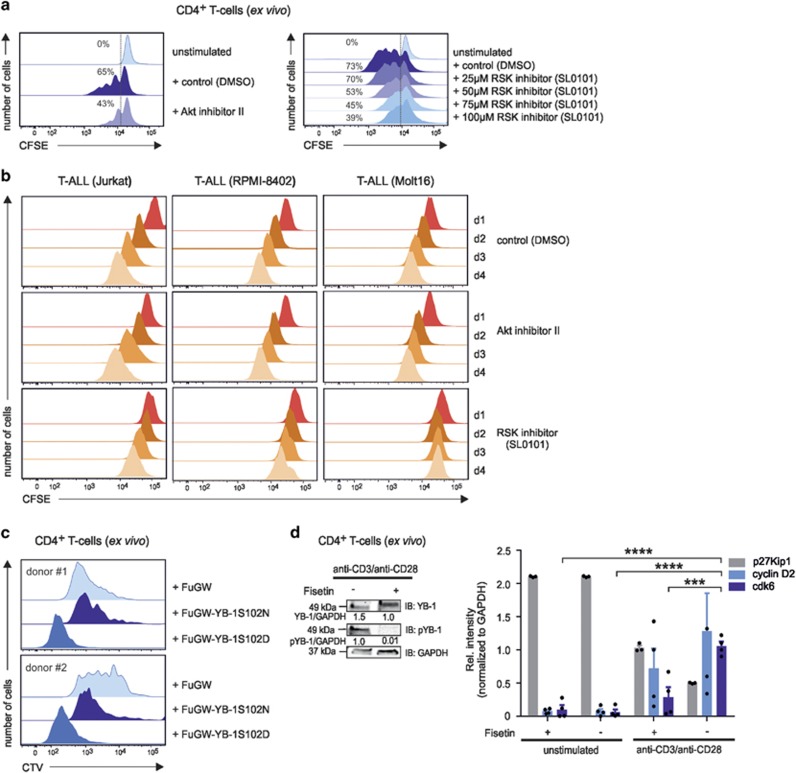
Figure 5.
The impact of Akt, PKC, and RSK kinases on primary and malignant CD4+ T-cell proliferation. (a) CD4+ T cells were labeled with carboxyfluorescein succinimidyl ester CFSE; 1.6 μM) and subsequently stimulated with anti-CD3/anti-CD28-coupled beads. At day 3, Akt inhibitor II was added as described in Figure 3a. The RSK inhibitor was used at increasing concentrations (25–100 μM) as depicted. At day 5, flow cytometric analysis of CFSE-stained CD4+ T cells was used to track multiple mitotic events of single cells. The histograms illustrate the proliferation of anti-CD3/anti-CD28-stimulated CD4+ T cells with or without inhibitors, as indicated. Activated CD4+ T cells preincubated with DMSO served as controls. Numbers indicate the percentage of dividing cells. One representative example is shown out of three experiments. (b) CFSE-labeled T-ALL cell lines were cultured with inhibitors against Akt or RSK for 4 days. Dividing Jurkat, RPMI-8402, and Molt16 cells were analyzed daily using flow cytometry. The histograms illustrate the proliferation of cells from day 1 in the presence or absence of specific inhibitors. DMSO-treated Jurkat, RPMI-8402, and Molt16 cells served as controls. One representative example is shown out of three experiments. (c) Proliferation analysis of GFP-YB-1-S102D- and GFP-YB-1-S102N-expressing primary CD4+ T cells. Constructs were lentivirally transduced in CTV-labeled and, for 48 h, in preactivated CD4+ T cells. At day 5, flow cytometric analyses of CTV-stained CD4+ T cells was used to track cell-cycle progression. The histograms illustrate the proliferation of GFP-YB-1-S102D-, GFP-YB-1-S102N-, and control vector-expressing CD4+ T cells of two different donors. (d) Phosphorylation of YB-1 Ser102 in CD4+ T cells is abrogated in the presence of the inhibitor Fisetin (60 μM) after 48 h of stimulation. Total cell lysates (proteins from four different donors were pooled) were prepared, and immunoblotting was performed. Glyceraldehyde 3-phosphate dehydrogenase (GAPDH) was used for internal normalization and relative intensities are shown below the blot. One representative example is shown out of three experiments. G1-phase cell-cycle arrest mediated by Fisetin incubation in primary human CD4+ T cells. CD4+ T cells isolated from four different donors were stimulated for 48 h either with IgG1 isotype or anti-CD3/anti-CD28-coupled beads in the presence or absence of Fisetin. Total cell lysates (proteins from four different donors were pooled) were prepared, and immunoblotting was performed. Relative band intensities normalized to GAPDH are shown in the graph. The data are summarized from three different experiments. The mean value and S.E.M. are indicated, and for statistics, analysis of variance was applied. ***P<0.001, ****P<0.0001

