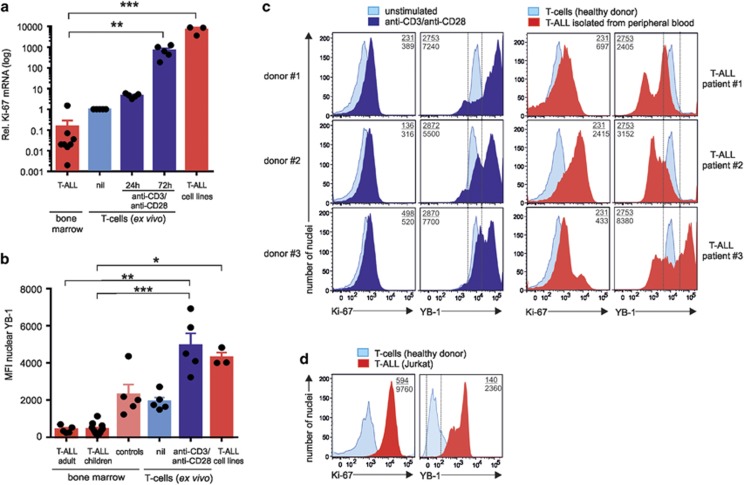
Figure 6.
Nuclear YB-1 content in samples isolated from T-ALL patients. (a) Analysis of proliferation marker Ki-67 in primary, malignant CD4+ T cells and T-ALL cell lines. Total RNA was isolated from T cells of bone marrow samples from T-ALL patients (n=8) and from resting (nil) and 24–72 h activated CD4+ T cells (n=5) from healthy individuals, respectively, and analyzed by qRT-PCR. Graph shows relative transcript numbers of Ki-67 mRNA. The means and S.E.M. are indicated. P-values are shown (analysis of variance (ANOVA)). (b) Nuclei of cells isolated from bone marrow samples of T-ALL patients (adult, n=5; children, n=11) and indicated controls such as nuclei isolated from cells of patients in remission or 24 h inactivated/activated CD4+ T cells, or T-ALL cell lines, were isolated, fixed, and permeabilized as described in Figure 2c. The graph demonstrates the mean nuclear YB-1 expression of T-ALL patients and controls. Significances are determined using ANOVA. *P<0.05, **P<0.01, ***P<0.001. (c) Demonstration of the nuclear YB-1 in the isolated nuclei of lymphoblasts isolated from peripheral blood of T-ALL patients compared with inactivated/activated CD4+ T cells isolated from three different donors. Primary CD4+ T cells were stimulated for 24 h. Nuclei were isolated, fixed and permeabilized, and stained for YB-1 as described in Figure 2c. Nuclear co-staining was performed with direct fluorescence-labeled anti-Ki-67 Ab. Numbers shown correspond to the mean fluorescence intensity (MFI) of YB-1- or Ki-67-positive nuclei of lymphoblasts from T-ALL patients (number below), stimulated (number below), or unstimulated T cells (number on top). (d) Nuclear YB-1 in the isolated nuclei of Jurkat cells compared with the nuclei isolated from resting CD4+ T cells. Nuclei were isolated, fixed and permeabilized, and stained for YB-1 as described in Figure 2c. Nuclear co-staining was performed as described before. Numbers shown symbolize the MFI of YB-1- or Ki-67-positive nuclei of Jurkat T cells (number below) or resting T cells (number on top). One representative example is shown out of three experiments

