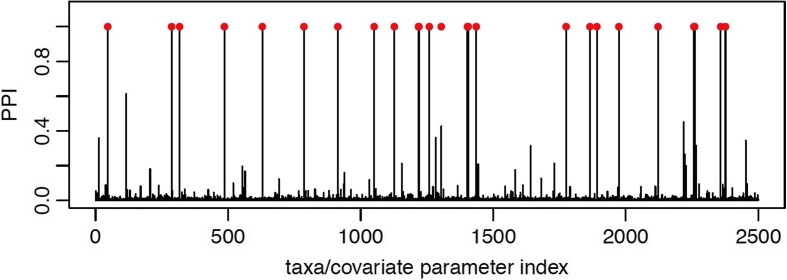
Fig. 2.
Simulated data: Marginal posterior probabilities of inclusion (PPI) for each coefficient β jp, j=1,…,50, p=1,…,50, describing the association between each taxa and each covariate. Each PPI is obtained by averaging the number of times that each taxa/covariate association is included across the MCMC iterations, after burn-in. The true associations are indicated as red dots

