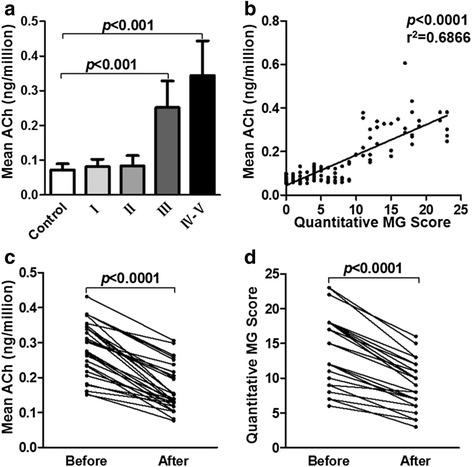
Fig. 2.

PBMC-derived ACh levels correlate positively with MG severity. a Histogram shows that ACh concentrations per million cells increased along with MG severity according to the MGFA clinical classification (n = 50 for control, n = 58 for class I, n = 30 for class II, n = 24 for class III, n = 13 for class IV-V) (p < 0.0001). b ACh level distribution relative to QMG scores (n = 125) (p < 0.0001). c ACh content decreased in patient’s blood drawn before treatment and 2 weeks after initial treatment, respectively (p < 0.0001). d QMG scores also decreased in patients (p < 0.0001). (c-d; n = 30 in each group)
