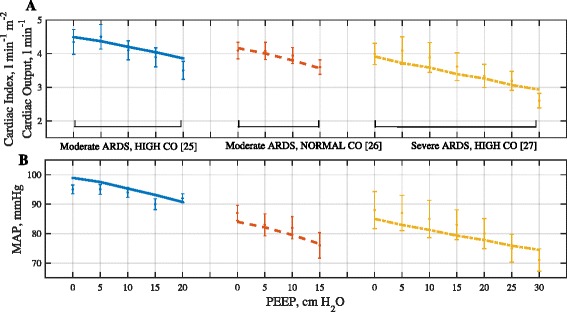
Fig. 2.

Results of fitting model outputs for hemodynamic variables to patient data. a Cardiac index (or Cardiac output for the case of Moderate ARDS, Normal CO) and b MAP. The lines represent the model results while the error bars depict the data. Three patients are: Moderate ARDS High CO (blue), Moderate ARDS Normal CO (red), Severe ARDS High CO (yellow)
