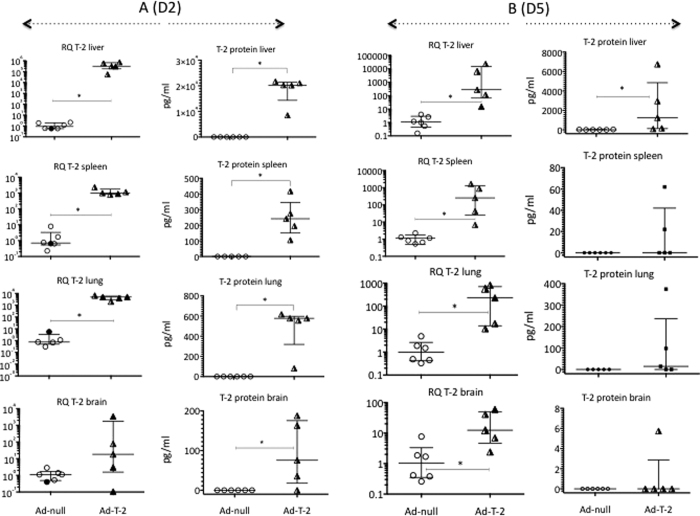
Figure 2.
Quantification of tissue T-2 transcripts and T-2 protein levels at D2 (A) and D5 (B) post PbANKA infection. C57BL/6 mice were inoculated i.p at D0 with either 108 pfu of Ad-null- or Ad-T-2, and they were treated two days later i.p with 105 GFP-transgenic PbANKA. Two (D2, A) or five (D5, B) days later, T-2 mRNA levels (from left to right, columns 1 and 3) were measured by RT q-PCR in different organs: Rq ( = 2−∆∆Ct), using HPRT as the normalizer gene and ‘Ad-null + PbANKA’ as the reference treatment. In parallel, T-2 protein levels were measured by ELISA in tissue extracts of the same organs (columns 2 and 4). In each column, Ad-null and Ad-T-2 results were compared and *Indicates when median ( + /− inter-quartiles) values were found significantly different (Mann-Whitney test, p < 0.05).

