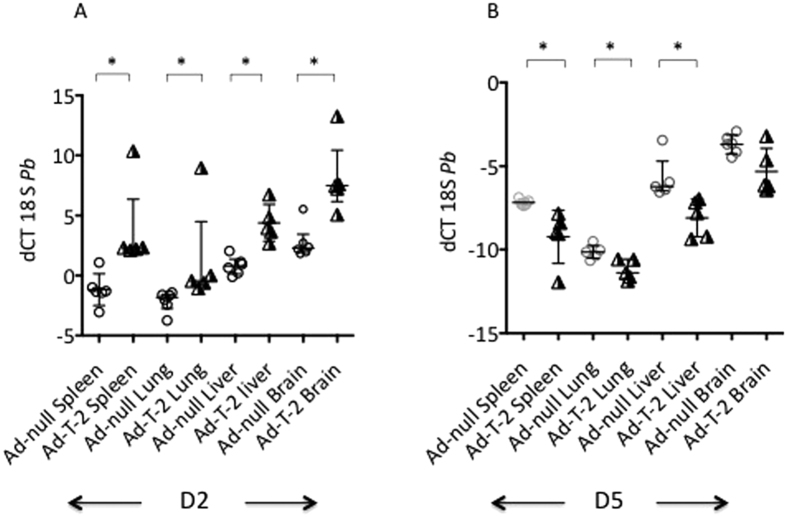
Figure 3.
Quantification of tissue PbANKA 18 S mRNA levels at D2 (A) and D5 (B) post PbANKA infection. The same samples obtained for Fig. 2 analysis were assessed for PbANKA 18 S mRNA expression at D2 (A, left graph) and D5 (B, right graph) in the same organs. dCT = (CT 18 S minus CT HPRT) was used as a read-out for parasite load. Each individual symbol represents a different animal. Ad- T-2 + P.b and Ad-null + P.b were compared at each time point, and for each organ, and *Indicated when median ( + /− inter-quartiles) values were found significantly different (Mann-Whitney test, p < 0.05).

