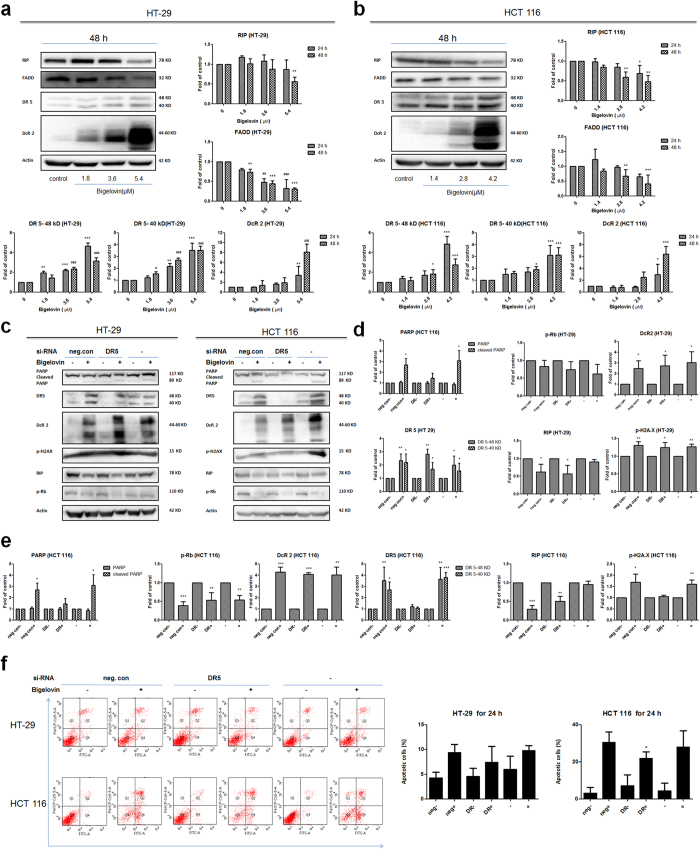
Figure 4. Bigelovin activated extrinsic apoptosis pathway and DR 5 is a target for bigelovin-induced apoptosis.
Western blot analysis of protein expression involved in bigelovin-induced extrinsic pathway in HT-29 (a) and HCT 116 (b) at indicated doses at 48 h and quantitative data, adjusted relative to actin protein level and expressed as fold of control (mean ± SD for 3–4 independent experiments). Two cell lines were transfected with DR 5 siRNA or control siRNA alone. After 24 h, cells were treated with bigelovin (5.4 μM for HT-29 and 4.2 μM for HCT 116 cells) for additional 24 h and subjected to Western blot analysis (c–e) and Annexin V and PI double staining by flow cytometry (f). (d,e) Are quantitative data for Western blot and (f) is quantitative data for Annexin V and PI double staining. Each assay was performed for at least 3 times and presented in mean ± SD; *p < 0.05, **p < 0.01, ***p < 0.001 vs. siRNA transfection control at the same time point.

