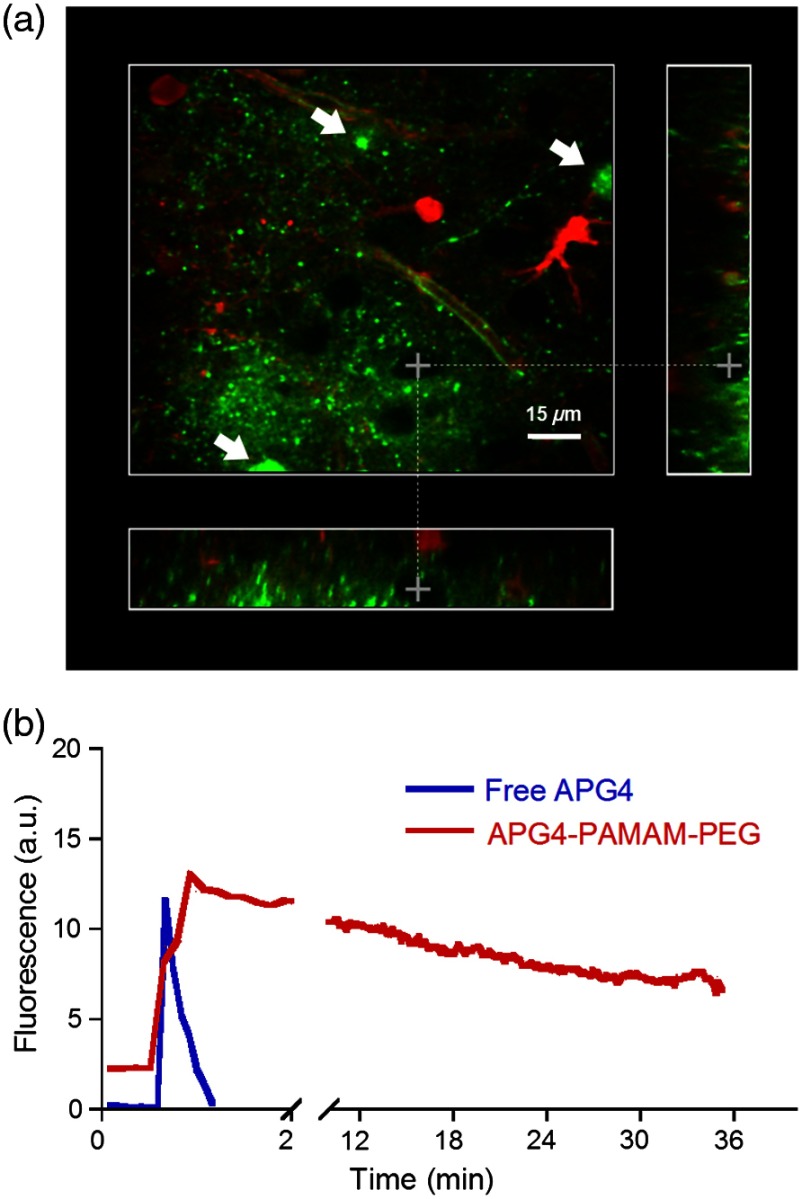
Fig. 5.
Retention of the potassium nanosensor in the ECS. (a) Fluorescence of the nanosensor (green) injected in the ECS as measured by two-photon microscopy in a mouse acute brain slice ( 800 nm) with concurrent SR101 staining of glial cells (red). White arrows indicate microinjection sites. (b) Fluorescence retention of APG4 of free APG4 locally applied compared with the retention of the APG4 PAMAM-PEG nanosensor in the same conditions.

