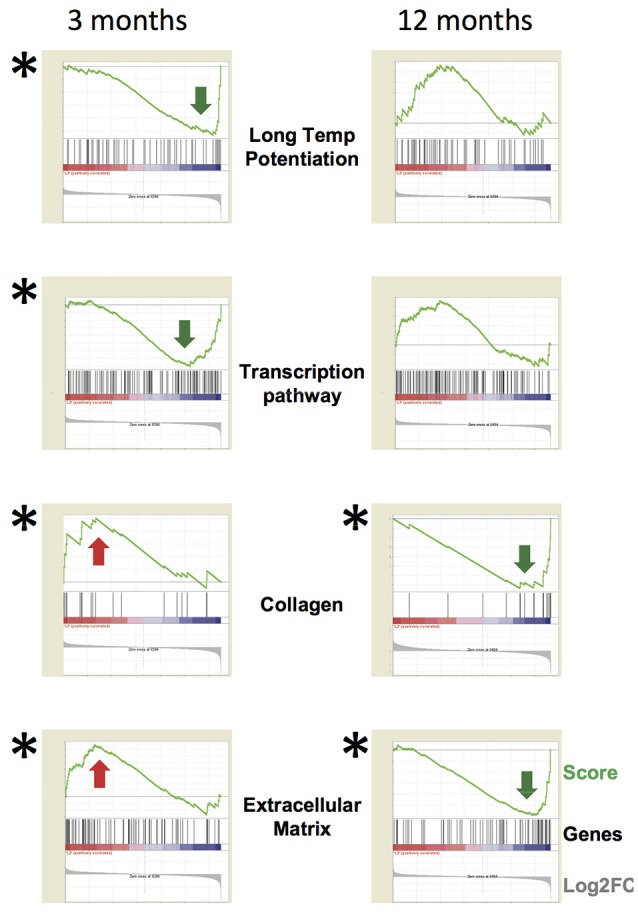
Figure 6.

Functional analysis of specific gene categories. The whole dataset was analyzed by the tool GSEA (Gene Set Enrichment Analysis). FDR q < 0.05 (statistically significant) is indicated by (*) (obtained by gene set permutation). The GSEA analytical tool allows to identify small changes affecting a large set of functionally related genes compared to a per gene statistics. GSEA analytical tool allows to identify with high sensitivity global up- or down-regulation trends affecting large sets of functionally related genes. GSEA plots represent, for each functional category, a kind of summation integral of expression change for all single genes in the category. The methodology is sensitive even for small changes involving large gene sets. The GSEA plots highlight a general down-regulation of the Long Term Potentiation and Transcription systems at 3-months, while the Collagen and Extracellular Matrix categories are up-regulated at 3-months and down-regulated at 12-months. In each panel, the green line is the GSEA score plot, while the gray plot on the bottom of each panel is the global distribution of Log2 fold change for all genes, with up-regulated genes on the left and down-regulated ones on the right. The black thin bars on the bottom of each sub-panel indicate the genes belonging to the functional category, with each bar position corresponding to the specific score and Log2 fold change levels in the two plots. The following link provides information about how to interpret GSEA data and plot: http://software.broadinstitute.org/gsea/doc/GSEAUserGuideFrame.html?Interpreting_GSEA.
