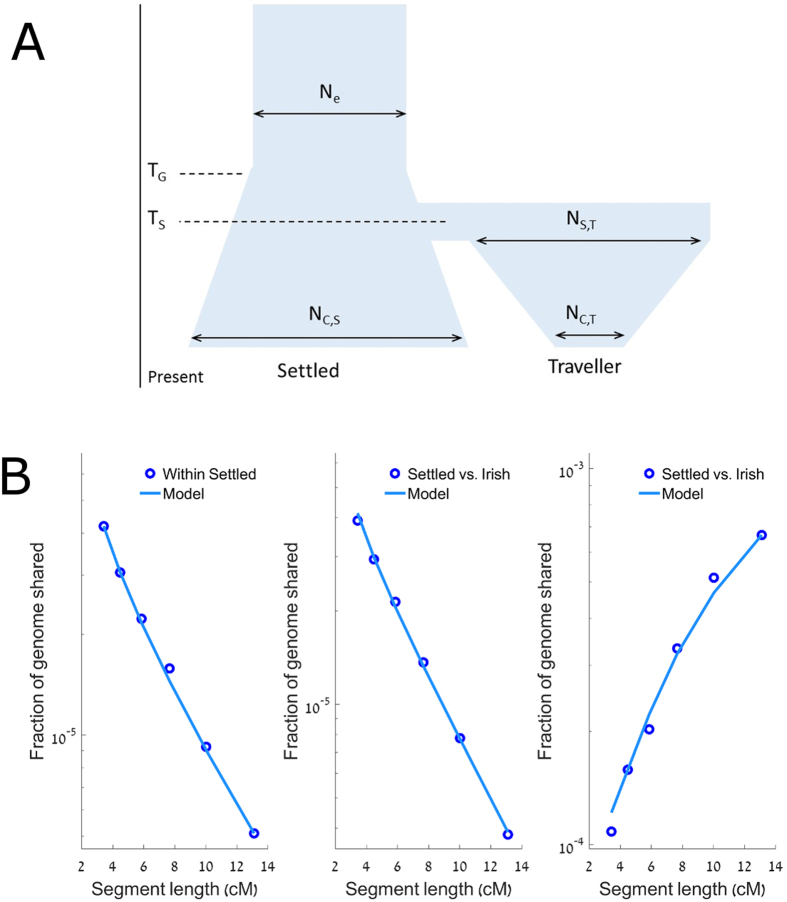
Figure 5.
(A) The model used for demographic inference. The two populations were one ancestral population, with size Ne, TG generations ago. At this point the ancestral population started to grow exponentially until TS generations ago, where the ancestral Traveller and settled populations split from each other, with NS,T being the initial starting population size of the Traveller population. The settled population experienced continued exponential growth until the present, with a population size of NC,S. The Traveller population experienced a period of exponential contraction until the present, with a population of NC,T. (B) The proportion of the genome in IBD segments vs the IBD segments length. The total genome size and the sum of segment lengths were computed in cM. Left: sharing between pairs of settled Irish; middle: sharing between pairs of one settled and one Traveller individuals; right: sharing between pairs of Traveller Irish. Each data point is located at the harmonic mean of the boundaries of the length interval it represents.

