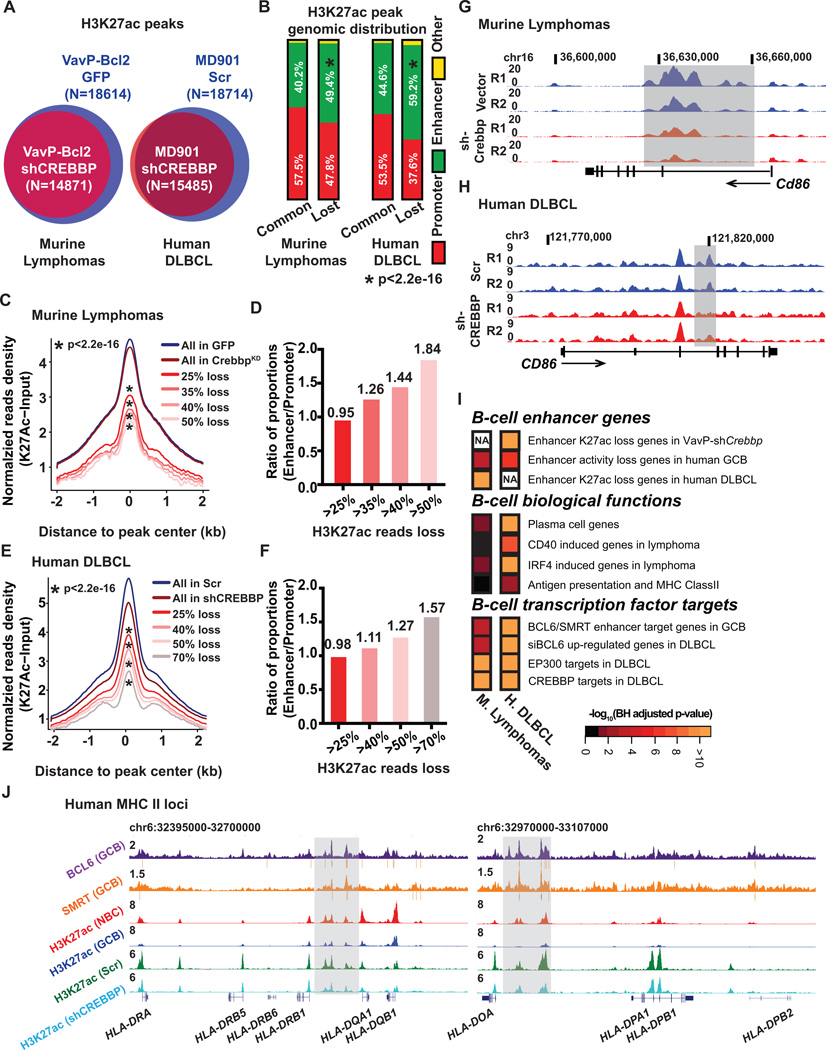
Figure 2. Crebbp deficiency results in focal H3K27ac loss in mouse and human lymphoma.
A, Venn diagrams showing the overlap between the H3K27ac peaks in B220+ cells from VavP-Bcl2/GFP tumors (n=4) or from VavP-Bcl2/shCrebbp tumors (n=6) (left panel), or the overlap between the H3K27ac peaks in MD901 cells transduced with either control scramble shRNA (n=3) or shRNAs against CREBBP (n=6) (right panel). B, Stacked bar plot representing the genomic distribution of common and lost H3K27ac peaks between VavP-Bcl2/GFP and VavP-Bcl2/shCrebbp tumor cells (left panel), or between MD901 cells transduced with either control scramble or CREBBP shRNAs (n=6). C, Normalized average H3K27ac read density plot at loci identified as H3K27ac peaks in MACS-purified B220+ B cells from VavP-Bcl2/GFP tumors. The black line represents the average values in VavP-Bcl2/EV tumors (n=4), and the dark red line represents the values in VavP-Bcl2/shCrebbp tumors (n=6). Average values of peaks that exhibited more than 25%, 35%, 40%, and 50% reads loss in VavP-Bcl2/shCrebbp tumors as compared to VavP-Bcl2/GFP tumors are shown as lines in different shades of red. * representing statistical significant loss of normalized H3K27ac read density as determined by Kolmogorov-Smirnov test. D, Bar plot representing ratio of the proportions of enhancer peaks or promoter peaks that exhibited more than 25%, 35%, 40%, and 50% reads loss in VavP-Bcl2/shCrebbp tumors as compared to VavP-Bcl2/GFP tumors. E, Normalized average H3K27ac read density plot at loci identified as H3K27ac peaks in scramble shRNA transduced MD901 cells. The black line represents the average values in scramble shRNA transduced MD901 cells (n=3), and the dark red line represents the values in CREBBP shRNAs transduced MD901 cells (n=6). Average values of peaks that exhibited more than 25%, 40%, 50%, and 70% reads loss in CREBBP KD cells as compared to control scramble cells are shown as lines in different shades of red. * representing statistical significant loss of normalized H3K27ac read density as determined by Kolmogorov-Smirnov test. F, Bar plot representing ratio of the proportions of enhancer peaks or promoter peaks that exhibited more than 25%, 40%, 50%, and 70% reads loss in CREBBP KD cells as compared to control scramble MD901 cells. G, UCSC read-density tracks of normalized H3K27ac ChIP-seq reads at murine Cd86 locus in two representative VavP-Bcl2/GFP tumors and two representative VavP-Bcl2/shCrebbp tumors. Shaded areas highlight the regions showed loss of H3K27ac in VavP-Bcl2/shCrebbp tumors. H, UCSC read-density tracks of normalized H3K27ac ChIP-seq reads at human CD86 locus in two representative biological replicates of control scramble (Scr) MD901 cells and two representative biological replicates of CREBBP KD (shCREBBP) MD901 cells. Shaded areas highlight the regions showed loss of H3K27ac in KD cells. I, Pathways analysis of genes (n=1147) with > 25% reduction of H3K27ac reads at enhancers in murine VavP-Bcl2/shCrebbp tumors, or genes (n=2928) with > 25% reduction of H3K27ac reads at enhancers in CREBBP knockdown cells. Heatmap represents the BH-adjusted p value of each geneset tested. J, UCSC read-density tracks of normalized BCL6 (purple) and SMRT (orange) ChIP-seq reads in human tonsilar GCBs, H3K27ac ChIP-seq reads in human tonsilar NBCs (red) and GCBs (blue), and H3K27ac ChIP-seq in control scramble (Scr, green) and CREBBP KD (shCREBBP, turquoise) MD901 cells at the human MHC II loci. BCL6 and SMRT peaks determined by MACS2 are indicated by grey bars under the read density track. Shaded areas highlight the enhancers that were bound by BCL6 and SMRT, and showed loss of H3K27ac in CREBBP KD cells.

