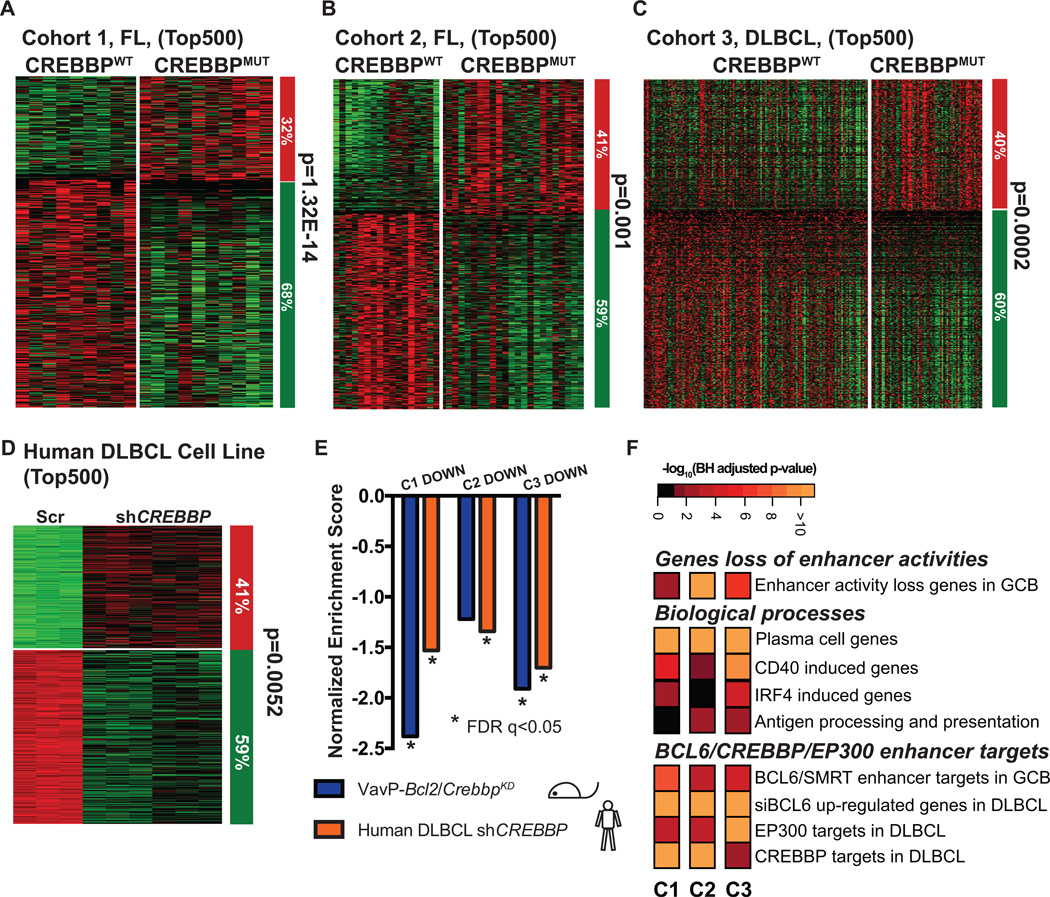
Figure 3. CREBBP loss of function results in gene expression repression signature.
A–D, Supervised analysis of the top 500 most differentially expression genes between CREBBP WT (CREBBPWT) and mutant (CREBBPMUT) FL (A, B), DLBCL patients (C), or between scramble and CREBBP knockdown MD901 cells (D). Columns represent individual samples, rows correspond to the genes. Heatmap represents the z-scores of the expression value (RPKM) characterized by RNA-seq. The column on the right represents the proportion of the genes that were repressed (green) or upregulated (red) CREBBPMUT patient samples as compared to CREBBPWT patient samples (A–C), or in CREBBP knockdown cells as compared to scramble control samples of the respective cohorts (D). Statistical significance was determined by Fisher Exact test. E, Summary of the GSEA of the down-regulated genes in the top 500 most differentially expressed genes of respective cohorts as compared to ranked gene expression changes between either murine VavP-Bcl2/CrebbpKD and VavP-Bcl2/EV murine tumors (purple bars) or between CREBBP KD and Scr MD901 cells (orange bars). * indicates statistical significant enrichment (FDR q<0.05). F, Pathway analysis of the down-regulated genes within the top 500 most differentially expressed genes of respective cohorts. Heatmap represents the –log10 BH-adjusted p-value of each geneset tested.

