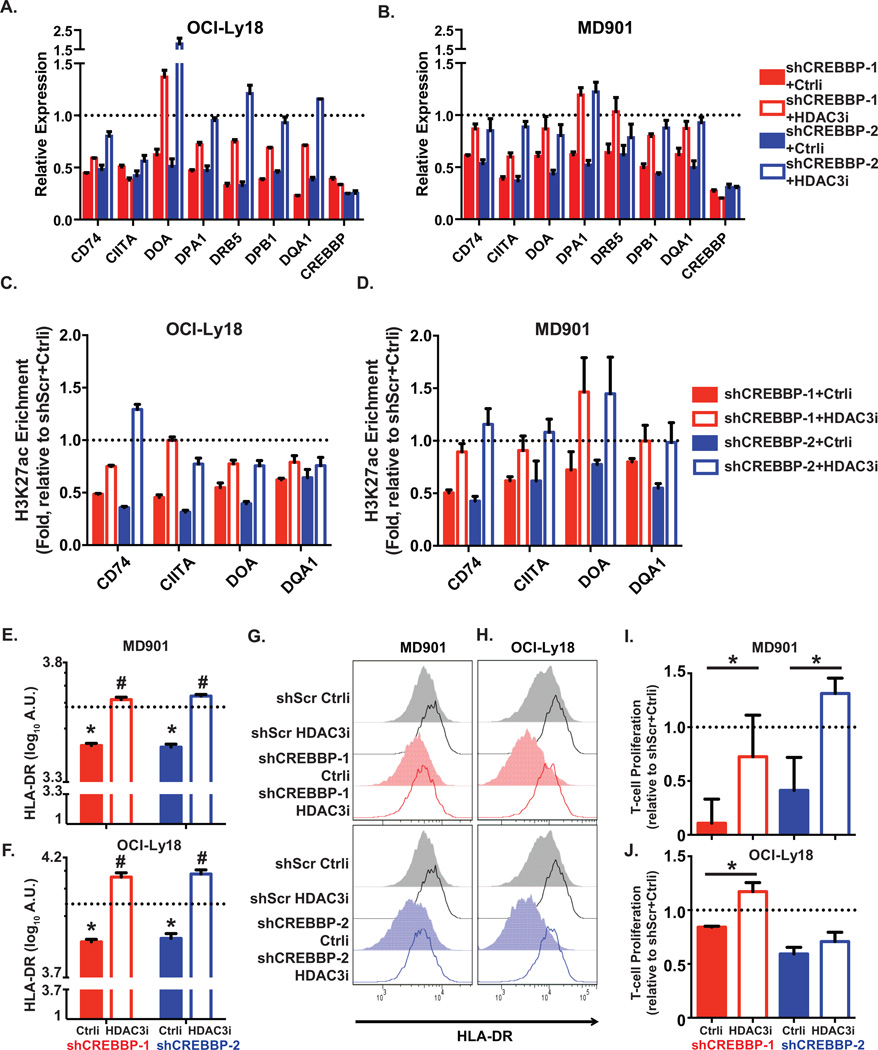
Figure 5. CREBBP regulates antigen processing and presentation gene enhancers.
A,B, Bar plots representing the relative expression of antigen presentation and MHC II genes in OCI-Ly18 (A) and MD901 (B) cells upon CREBBP depletion and treated with either a selective HDAC3 inhibitor (HDAC3i) or a control compound (Ctrli), as compared to scramble shRNA induced cells (set as 1, dotted lines). Bar graph represents mean and S.E.M. from three replicates. C,D, Bar plots representing the relative H3K27ac enrichment at enhancers of MHC II genes in OCI-Ly18 (C) and MD901 (D) cells upon CREBBP depletion and treated with either a selective HDAC3 inhibitor (HDAC3i) or a control compound (Ctrli), as compared to scramble shRNA induced cells (set as 1, dotted lines). Bar graph represents mean and S.E.M. from three replicates. E,F, Quantification of HLA-DR measured by flow cytometry in shCREBBP or scramble transduced lymphoma MD901 (E) and OCI-Ly18 (F) cells treated with either a selective HDAC3 inhibitor (HDAC3i) or a control compound (Ctrli). Cells were transduced with shRNAs for 3 days and then treated with compounds for 96hr. The data was represented as mean ± S.D. Statistical significance was determined by Student’s T-test. * indicates significant difference between control compound-treated scamble or shCREBBP transduced cells (p<0.05). # indicates significant difference between control compound and selective HDAC3 inhibitor treated cells (p<0.05). G,H, Representative flow cytometry histograms showing cell surface level of MHC II molecule HLA-DR that were quantified in E and F. I,J, Bar plots showing the relative proliferation of T-cells stimulated by shCREBBP or scramble transduced lymphoma MD901 (I) or OCI-Ly18 (J) cells treated with either a selective HDAC3 inhibitor (HDAC3i) or a control compound (Ctrli). The data indicate relative folds of T cell proliferation, represented as ratio of fluorescence (560nm/590nm) from each treatments to that from scramble shRNA transduced cells treated with control compound (set as 1, dotted lines). Statistical significance was determined by Student’s T-test.

