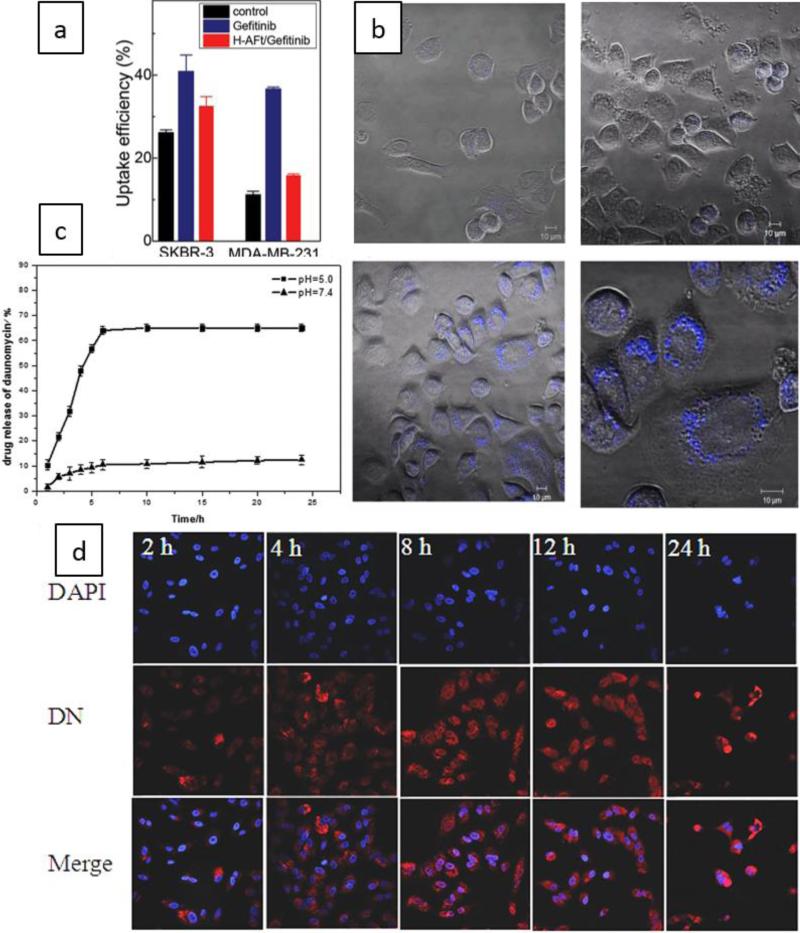
Figure 8.
a) Mean uptake efficiency by SKBR3 and MDA-MB-231 cells obtained from flow cytometry, b) Images of confocal microscopy indicating cellular uptake of control sample (upper images) and Gefitinib-loaded apoferritin NCs by SKBR3 cells (lower images) 198, Open Access, John Wiley & Sons, Inc., c) The curve indicating enhanced drug release for a DN-loaded pH-sensitive HA surface-modified apoferritin in more acidic conditions, d) Confocal images showing Internalization of the nanocarrier into A549 cells at different times (2, 4, 8, 12, and 24 hour), Reprinted with permission from ref. 199, Copyright 2015 Royal Society of Chemistry.

