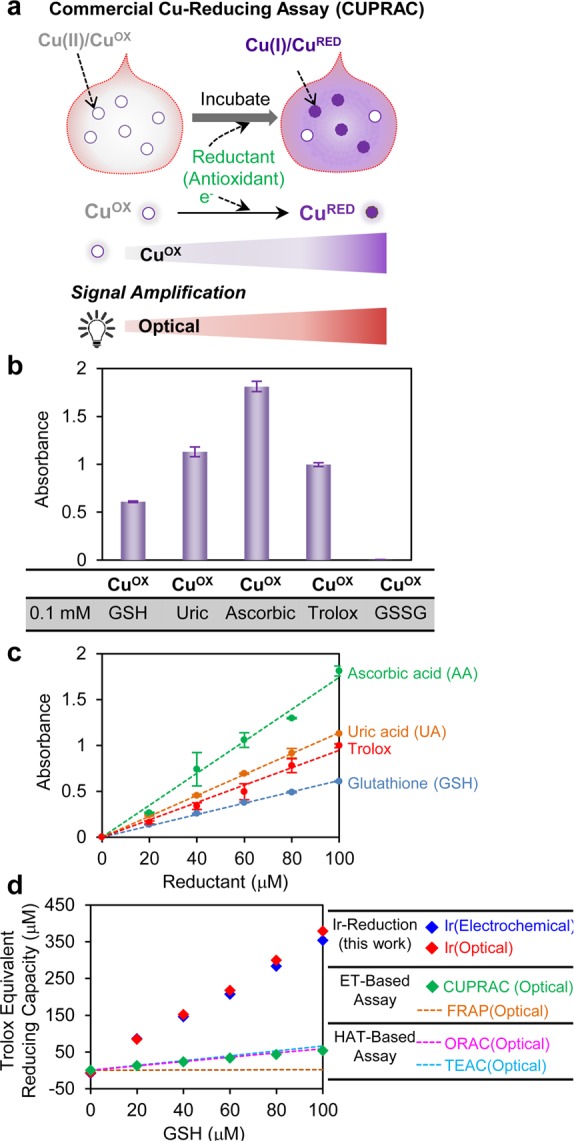
Figure 3.

Comparison of Ir-reducing assay with other methods. (a) Scheme illustrating commercial Cu-reducing assay. (b) Optical signal (absorbance) of CuOX when incubated with various reductants. (c) Optical signal increase of CuOX relative to the concentration of individual reductants. (d) GSH sensitivity of Ir-reduction assay compared with other methods (data from Ir-reduction and Cu-reduction assays were experimentally measured while the best fit lines were from Cao et al. (1998).49 Measurements in parts b–d were performed in triplicate (all error bars indicate standard deviation).
