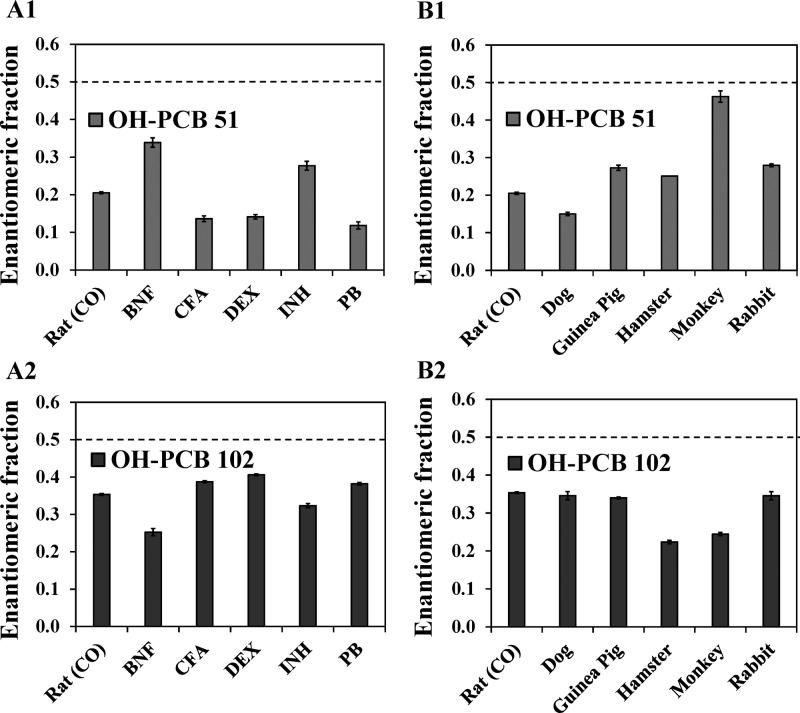
Figure 4.
Enantiomeric fraction (EF), a measure of the extent of the enantiomeric enrichment, of OH-PCB 51 and OH-PCB 102 depends of the composition of the hepatic cytochrome P450 system in rats and differs between mammalian species (analyzed as the corresponding methylated derivatives). EF values of (A1) OH-PCB 51 and (A2) OH-PCB 102 differ between incubations with microsomal preparations from rats pretreated with inducers of different P450 enzymes. Moreover, EF values (B1) OH-PCB 51 and (B2) OH-PCB 102 vary across incubations with liver microsomes obtained from different species. EF values were determined by valley drop method. The dotted line corresponds to the average EF value of representative samples after racemization at 300 °C for 2 h. Extracts from incubations with PCB 51 or PCB 102 were analyzed a Chirasil-Dex column at 140 °C after methylation of the OH-PCB metabolites with diazomethane. Data are presented as mean ± standard deviation (n = 3 incubations per microsomal preparation; n = 2 for OH-PCB 102 hamster microsomal preparation incubations). With the exception of monkey microsomal preparation, all EF values are significantly different from EF of corresponding racemic OH-PCBs (t test, p < 0.05). Abbreviations of inducers: BNF, β-naphthoflavone; CFA, clofibric acid; DEX, dexamethasone; INH, isoniazid; PB, phenobarbital.

