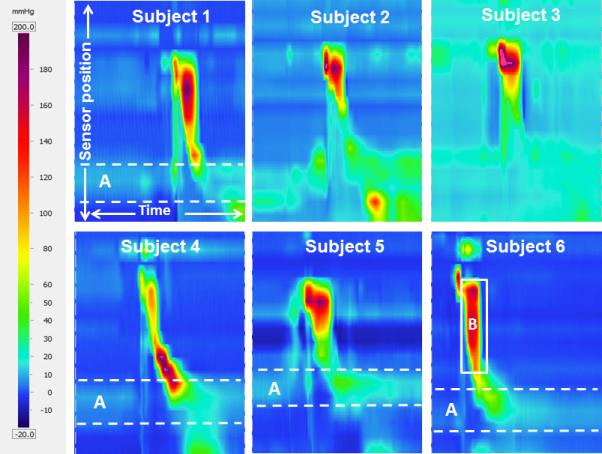
Figure 4.

Sample high-resolution manometry spatiotemporal plots representing one 10 cc swallow from each of the total laryngectomy subjects, demonstrating variability in the appearance of functional swallows. Sensor position is on the y- (vertical) axis, with sensors at the velopharynx at the top of the image and sensors in the esophagus at the bottom. Time is on the x- (horizontal) axis; each image represents 5 seconds of data collection. Pressure is represented by color as depicted on the left of the figure. A) Dashed white lines outline the zone which typically exhibits high tonic resting pressure at the upper esophageal sphincter; the high pressure zone is absent here. B) The solid white box outlines a region of common cavity pressure, where pressure is elevated and approximately uniform throughout the neopharynx.
