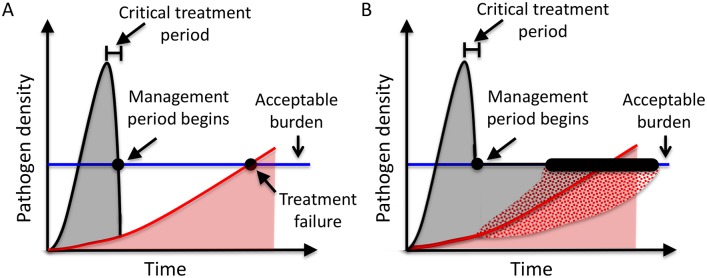
Fig 1. Generic model of infection under aggressive treatment (A) and containment (B).
Grey shading indicates the drug-sensitive density. Red shading indicates the drug-resistant density. Once a patient is infected, the total pathogen density (black curve) will increase until the patient experiences symptoms and seeks treatment. The infection will be treated to rapidly lower the total pathogen density to the acceptable burden (blue line). At this point (black dot), the management period begins and the time to treatment failure then depends on the subsequent treatment strategy. Under aggressive treatment (A), the total pathogen density continues to decline sharply until the infection consists only of completely drug-resistant pathogens. Under containment (B), the total pathogen density is maintained at the acceptable burden until the infection consists only of completely drug-resistant pathogens. Containment will modify the expansion of the resistant population, increasing or decreasing it (patterned areas), depending on the rate at which sensitive cells become resistant and the strength of competitive suppression.

