
Fig 6. Repeated bursts of MCα2 inhibition synchronize type A PC spike trains via minimally depressing IPSPs.
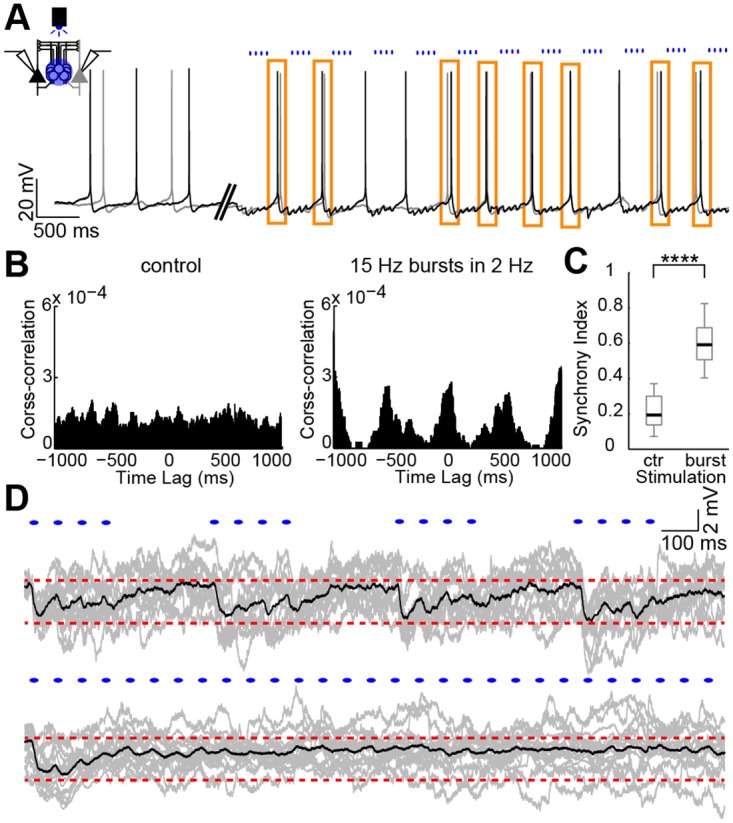
(A) Voltage traces from an unconnected pair of type A PCs (black and grey) with MCsα2 stimulated in 15-Hz bursts at 2 Hz (blue dots). Orange rectangles highlight synchronous APs. (B) Mean cross-correlograms (n = 24 cells) show little synchrony before light stimulation and increased synchrony during light stimulation (15-Hz bursts in 2 Hz) of MCsα2 as shown by a prominent peak around zero (and recurring peaks at every 500 ms). (C) Box plots of the synchrony indices for control and 15-Hz bursts show the significant increase of synchrony (0 no synchronization, 1 full synchronization) when MCsα2 are stimulated by blue light in brief bursts (n = 12 dual recordings, p < 0.0001, two-tailed Student’s paired t test). Values are shown in S8 Data. (D) IPSPs in type A PCs (n = 24 cells, single examples in grey, mean in black) following burst protocol of 15-Hz stimulation in 2 Hz (top) and constant 15-Hz light stimulation (bottom). Note minimal-depressing inhibition in the top and the depression of IPSPs leading to a rapid diminution of inhibition in the bottom (red dashed lines for improved visualization).