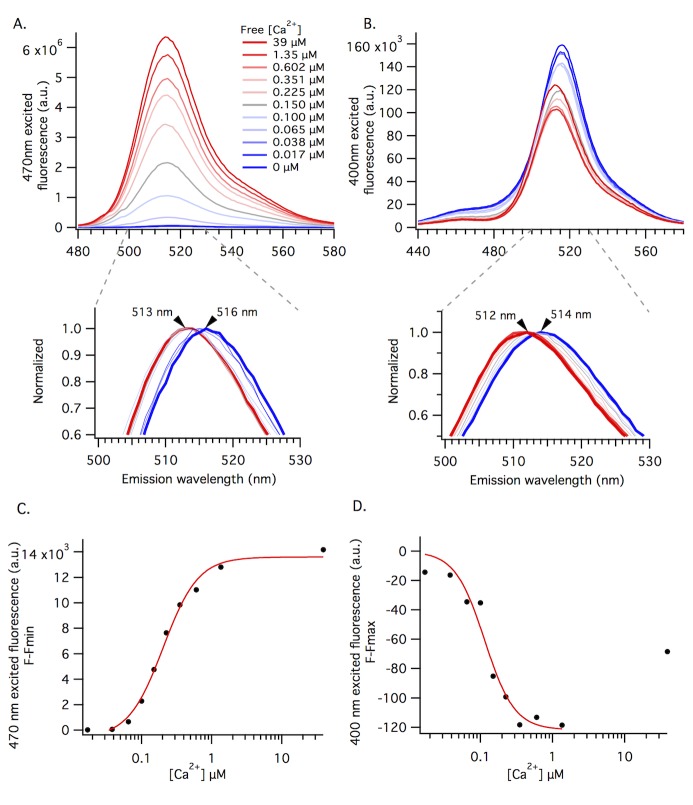
Fig 3. The GCaMP6m Ca2+-dependent spectra are consistent with four fluorescent states of the chromophore.
A and B) illustrate the Ca2+ concentration dependent fluorescence of GCaMP6m. 470nm (top, A) and 400 nm (top, B) excited fluorescence spectra for purified protein at 11 different buffered free Ca2+ concentrations, ranging from 0 μM (dark blue trace) to 39 μM (dark red trace), at pH 7.2. The 400 nm excited spectra for 39 μM free Ca2+ sample is marked with black arrow (B). Extended lower graphs highlight Ca2+ concentration dependent λmax with normalized 470 nm (A) and 400 nm (B) excited fluorescence (same spectra as top graphs). Arrows mark the apparent peak wavelength shift between 0 μM (dark blue trace) to 39 μM (dark red trace) buffered free Ca2+ concentrations. C and D) Peak fluorescence intensity values from spectra in 2A and 2B, respectively, plotted against buffered free Ca2+ concentration. F-Fmin (y-axis, 2C) is used for 470 nm excited fluorescence because baseline fluorescence in the 0 μM free Ca2+ buffer is the minimum fluorescence at this excitation wavelength. Alternatively, F-Fmax (y-axis, 2D) is used for 400 nm excited fluorescence because baseline fluorescence in the 0 μM free Ca2+ buffer is the maximum fluorescence at this excitation wavelength.

