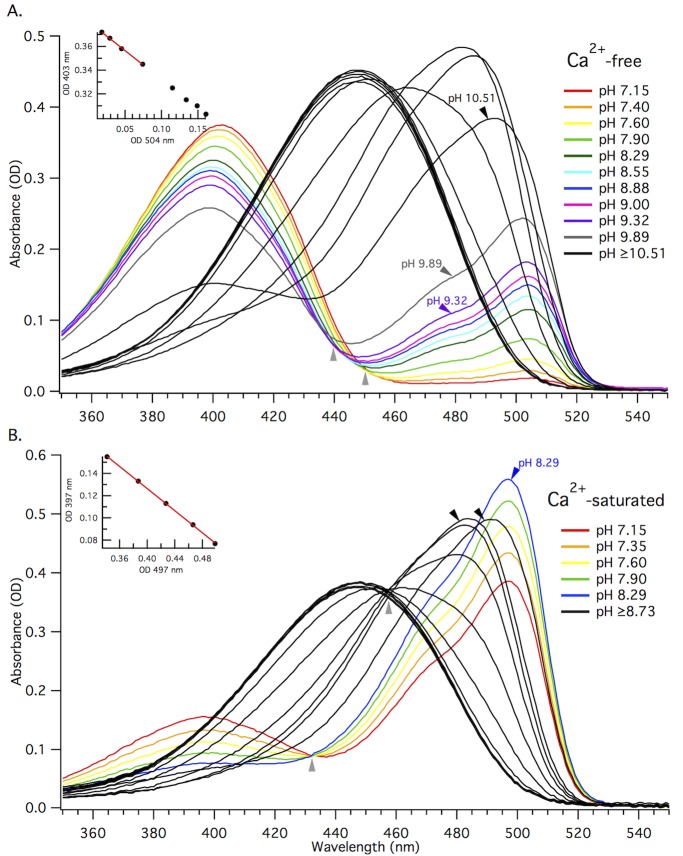
Fig 5. Alkaline titration makes it possible to measure the extinction coefficient of two different forms in the same sample.
A and B) Absorption spectra for alkaline titration of purified GCaMP6m protein in 0 μM free Ca2+ buffer (Ca2+-free, A) or 39 μM free Ca2+ buffer (Ca2+-saturated, B). Individual traces represent absorption spectra at different pH values. The final two colored traces and the first black trace for Ca2+-free sample (A) are marked with arrows. The last colored trace and first two black traces for Ca2+-saturated sample are marked with arrows (B). This boundary marks a significant pH dependent change in the shape of the absorption peak near 500 nm and the last spectrum where we see linear intercorrelation of the change in OD for the two peaks. Light grey arrows below traces mark the isosbestic points. The peak value at 447 nm (black trace), gives the total concentration of chromophore. Inset plots: Absorbance values for 403 nm versus 504 nm taken from the first 8 colored traces (from pH 7.15 to 9) of the absorption spectra for Ca2+-free GCaMP6m (A), and for 397 nm versus 497 nm taken from all of the colored traces (from pH 7.15 to 8.29) for Ca2+-saturated GCaMP6m (B). These plots illustrate the change in OD for the neutral form (397 nm or 403 nm) relative to the anionic (497 nm or 504 nm) form for the respective pH ranges. The red linear fit of the first 4 data points (from pH 7.15 to 7.90) for Ca2+-free (A) and all 5 data points for Ca2+-saturated (B) in the change in OD plots gives us the ratio of the extinction coefficients for the neutral and anionic forms in the given sample.

