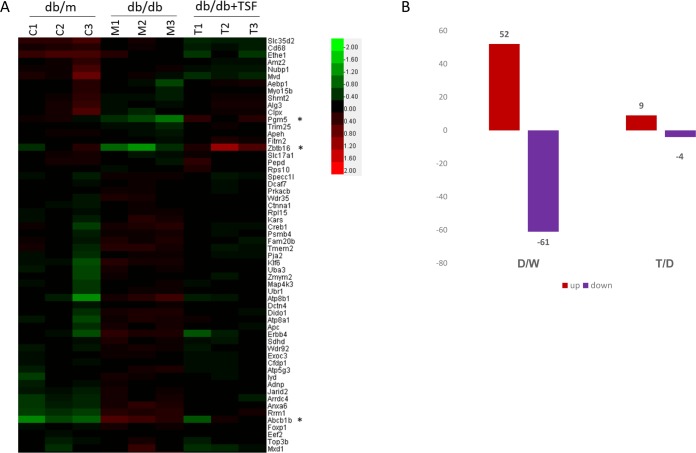
Fig 2. Gene expression microarray profiling.
(A) Heat map of microarray gene expression profiles of kidney tissue samples of db/m (n = 3), db/db (n = 3), and db/db (n = 3) mice treated with TSF; (B) The number of genes that were differentially expressed in the 3 groups; D, db/db mice; M, db/m mice; and T, db/db mice+TSF.

