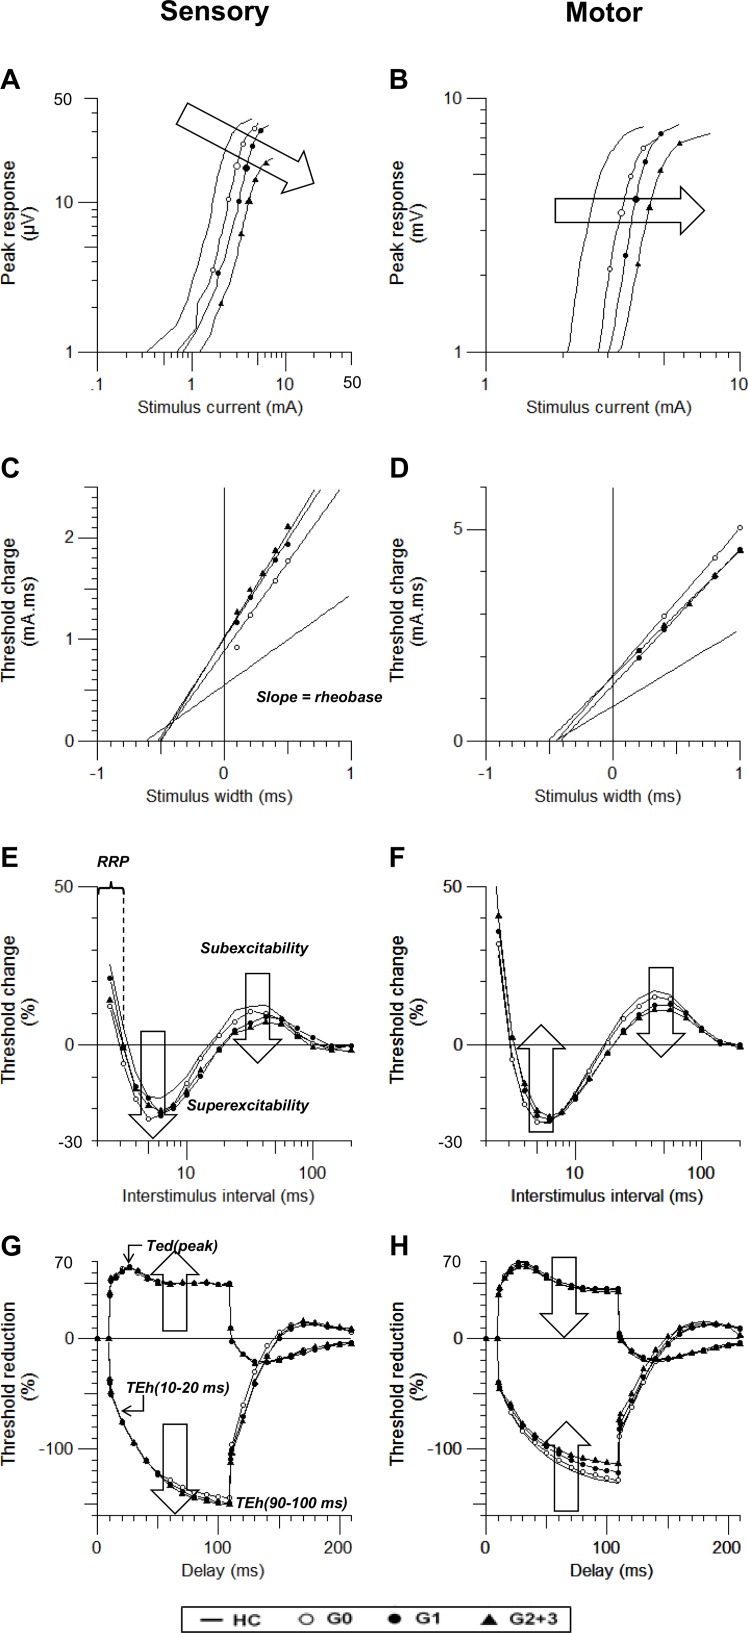
Fig 2.
(A and B) Comparison of the stimulus response curve, (C and D) strength-duration time constant, (E and F) recovery cycle, and (G and H) threshold electrotonus in diabetic patients (G0: empty circle, G1: filled circle, and G2: triangle) and healthy controls (line). Sensory profiles are shown in the left column, while motor profiles are shown in the right.

