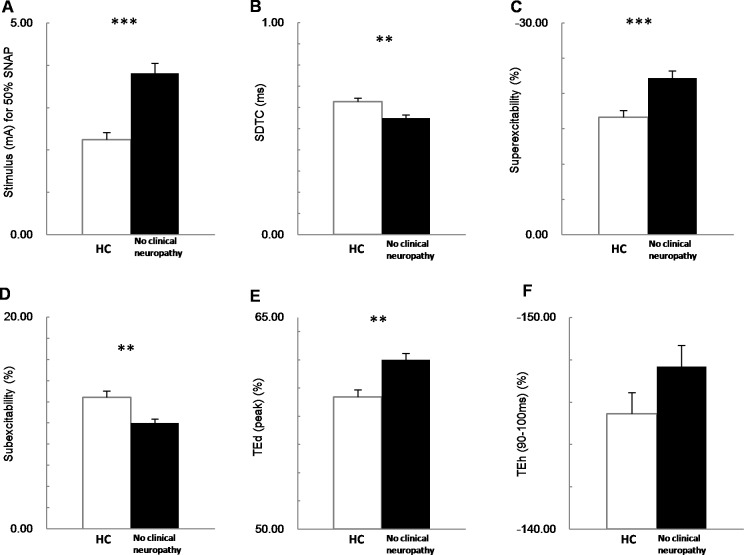
Fig 3. The difference between healthy control (HC, white bar) and type 2 diabetic patients who have no clinical neuropathy (no clinical neuropathy, black bar) in sensory nerve excitability parameters.
(A) No clinical neuropathy group shows greater threshold stimulus for 50% SNAP, (B) shorter strength-duration time constant (SDTC), (C) increased superexcitability, (D) decreased subexcitability, (E) greater peak of TEd, and (F) the TEh in a 90–100 ms time window. *P<0.05; ** P<0.01; *** P<0.001

