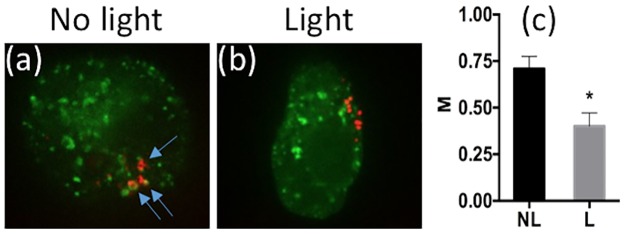
Fig 3. Colocalization of pDNA with Rab5.
(a) Typical image of pDNA and Rab5 distributions in a COS7 cell without light treatment. It was obtained with confocal microscopy. Blue arrows indicate the points of colocalization of rhodamine-labeled pDNA (red) and Rab5-GFP (green). (b) Typical image of pDNA and Rab5 distributions in another COS7 cell after light treatment. The PCI treatment was performed with the light-after protocol, where the cells were treated with light for 2 min at 20 min after electrotransfection. Then, cells were fixed with 2% paraformaldehyde and imaged with a confocal microscope. (c) Quantitative analysis of colocalization. Manders’ colocalization coefficient (M) was calculated for each z-stack of confocal images. The light (L) treated group showed a significant decrease in the colocalization of pDNA with Rab5, compared to the no light (NL) treated group. (n = 10, *P<0.0005, Mann-Whitney U test).

