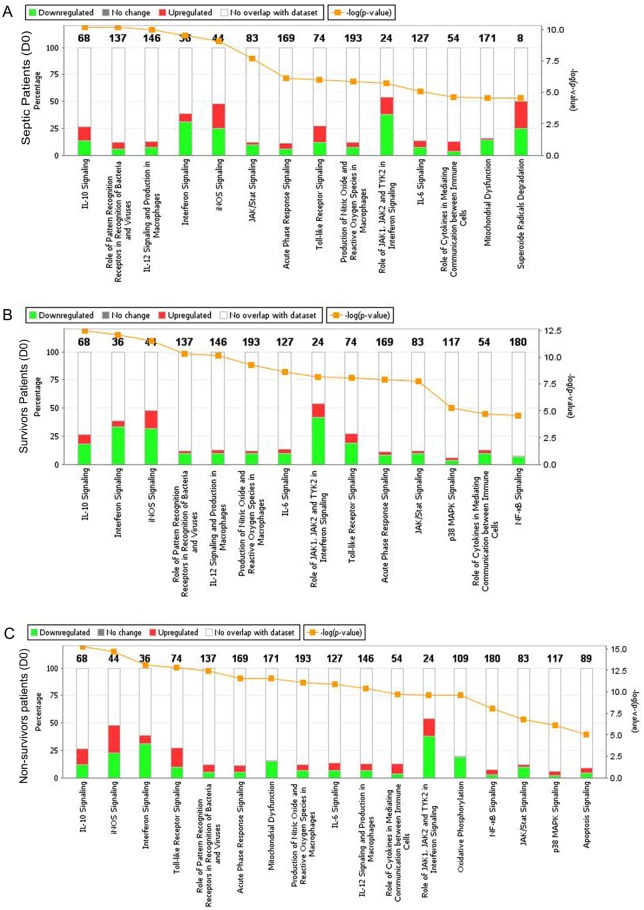
Fig 5. Canonical pathways affected by changes in gene expression during sepsis.
A. all patients; B. survivors; and C. non-survivors. The percentage of up-regulated and down-regulated genes in each selected canonical pathway can be measured in the percentage scale given on the y-axis (left side), in which red corresponds to the up-regulated genes and green corresponds to the down-regulated genes. The yellow line represents the −log (p-value) of affected genes in a given pathway. Canonical pathways with −log (p-value) higher than 4.5 are represented.

