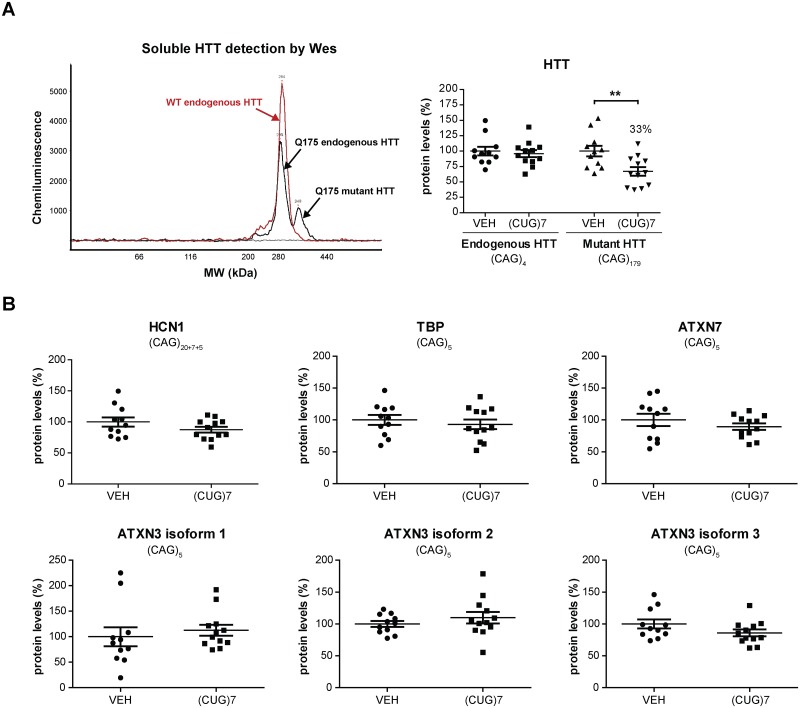
Fig 7. (CUG)7 effect on protein levels of mouse genes with non-expanded CAG-repeats.
(A) Levels of soluble mHTT protein quantified in Q175 cortex 18 weeks post last infusion using Wes analysis. The left graph depicts the chemiluminescence profile obtained using an antibody recognizing an epitope in exon 15 of HTT. A typical plot obtained in cortex of Q175 mice (in black) and in WT littermates (in red) is depicted. Only a single peak is present in WT mice representing mouse endogenous HTT protein, while in Q175 knock-in mice an additional peak with a higher molecular weight (MW) is visible representing mHTT protein with the expanded CAG repeat. In the right graph the data obtained with this antibody is shown. Data are presented as mean ± SEM. Significance was assessed for both endogenous and mutant HTT protein using a 2-tailed t-test comparing (CUG)7-treated Q175 mice to VEH controls (**p<0.01). (B) Protein levels of HCN1 (Hyperpolarization Activated Cyclic Nucleotide Gated Potassium Channel 1), TBP (TATA-Box Binding Protein), 3 different isoforms of ATXN3 (Ataxin 3) and ATXN7 (Ataxin 7) quantified in Q175 cortex 18 weeks post last infusion using Wes analysis. The number of uninterrupted CAGs is indicated in each graph. Data are presented as mean ± SEM. Significance was assessed using a 2-tailed t-test comparing (CUG)7-treated Q175 mice to VEH controls, but no significant differences were observed for any of the proteins tested.

