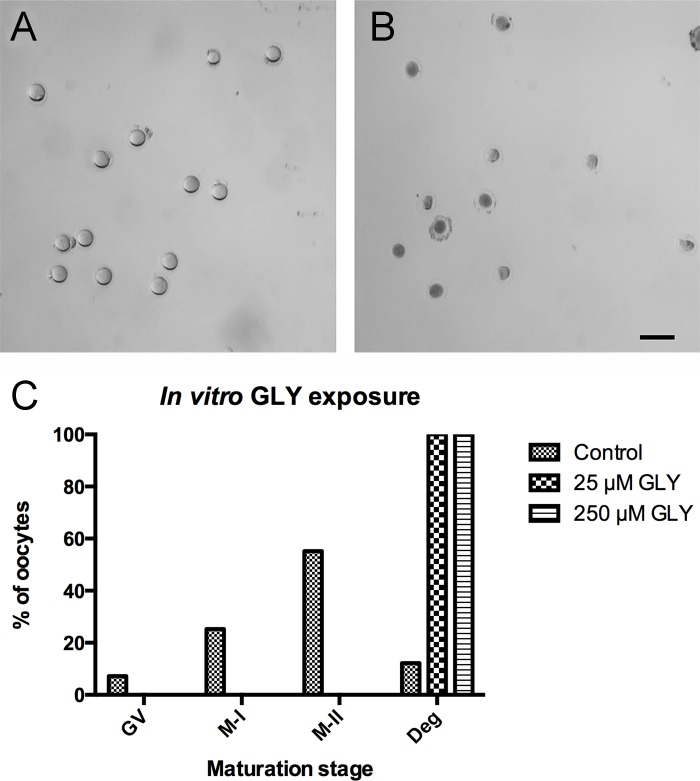
Fig 4. In vitro Effect of GLY on Oocyte Maturation.
In vitro-maturated oocytes were presented in control (A) and in vitro GLY-treated (B) groups. Bar graphs show the in vitro maturation stages of 0, 25 and 250 μM ACR-treated oocytes following 18 hours of incubation (C). The representative image in B was taken from a 25 μM GLY-treated group. The majority of the GV-stage oocytes reached the M-II stage in the control group, whereas all GLY-treated oocytes were degenerated following 18 hours of incubation (A-C). Scale bar: 200 μm.

