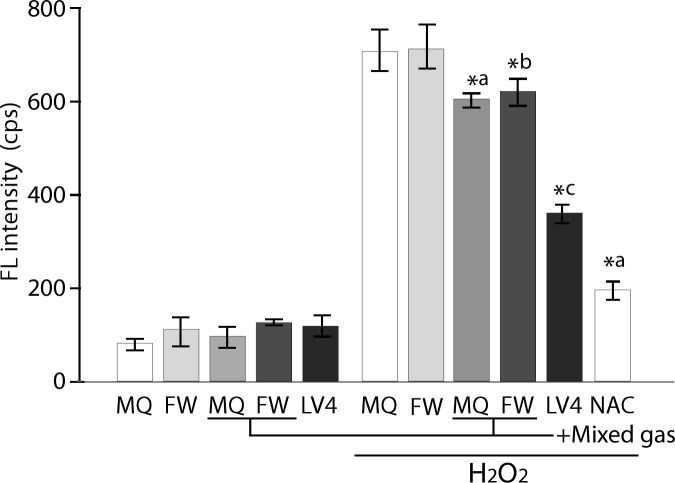
Fig 2. Measurement of the intracellular ROS intensity of controls and ERW using BES-H2O2 probe.
MQ, MilliQ water; FW, filtered pure water; +Mixed gas, H2, O2 and N2 mixed gas was bubbled through water to obtain DO and DH concentrations that are equal to those of LV4. The pH was also adjusted using sodium hydrate.; LV4, ERW at electrolysis level 4. NAC, 5 mM N-acetyl cysteine. *a, *b and *c indicate p values of < 0.01 when compared with the value for H2O2-treated MQ, FW and +Mix gas of FW, respectively.

