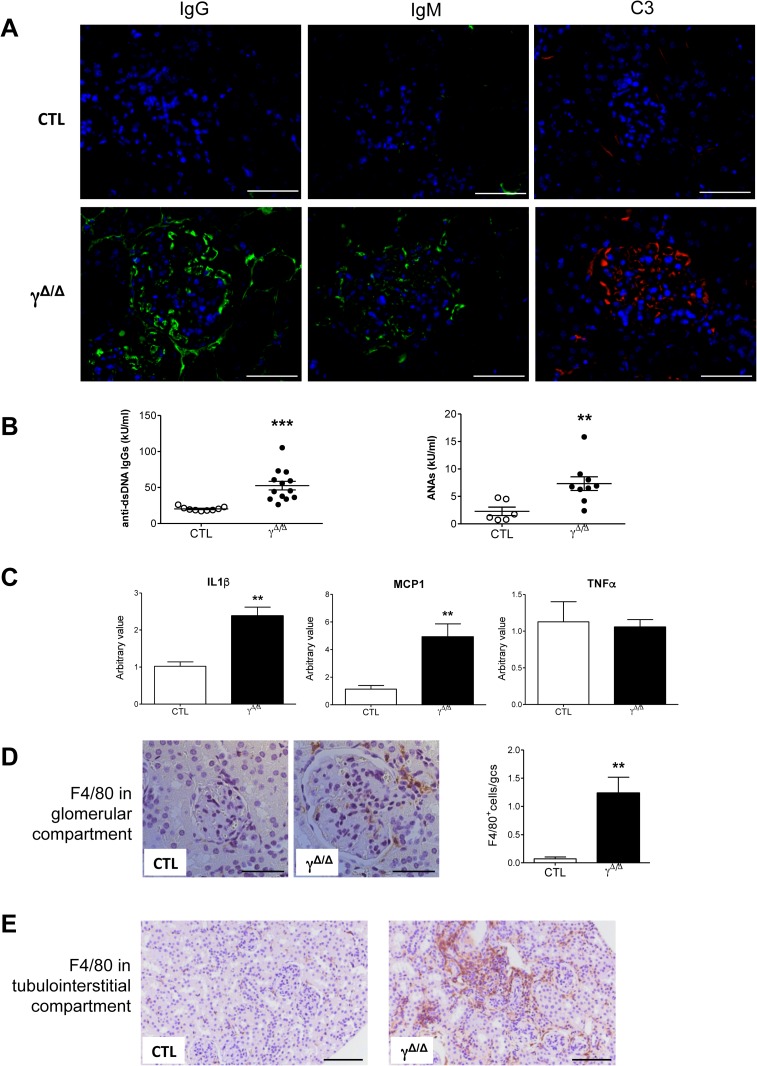
Fig 4. Renal immune complex deposition and inflammation in old PpargΔ/Δ mice.
(A) Immunofluorescence for IgG (left panel, green staining), IgM (middle panel, green staining), and C3 (right panel, red staining) deposition on frozen kidney sections of 52 weeks old control (CTL) and PpargΔ/Δ (γΔ/Δ) mice. The nuclei are labeled in blue (DAPI). Scale bar represents 50μm. (B) Plasma levels of anti dsDNA IgGs (9 controls and 13 PpargΔ/Δ P = 0.0003) and ANAs (6 controls and 9 PpargΔ/Δ P = 0.0098). (C) Evaluation of IL1β (5 controls and 7 PpargΔ/Δ P = 0.001), MCP1 (5 controls and 7 PpargΔ/Δ P = 0.0079), and TNFα (5 controls and 6 PpargΔ/Δ P = 0.799, not significant) gene expression by RT-qPCR in 52 weeks old control and PpargΔ/Δ animals. Results are reported as fold change with respect to control levels arbitrarily set to 1. Data are the mean ± SEM (D) The two left panels are representative images of F4/80 immunohistochemistry in glomeruli (scale bar represents 50μm). The right panel is a relative quantification of positive cells (stained in brown; 5 controls and 7 PpargΔ/Δ P = 0.0062). (E) Representative images of F4/80 immunohistochemistry in tubulointerstitial areas (scale bar represents 100μm) of 52 weeks old control and PpargΔ/Δ mice. *P<0.05, **P<0.01 PpargΔ/Δ vs. control littermates.

