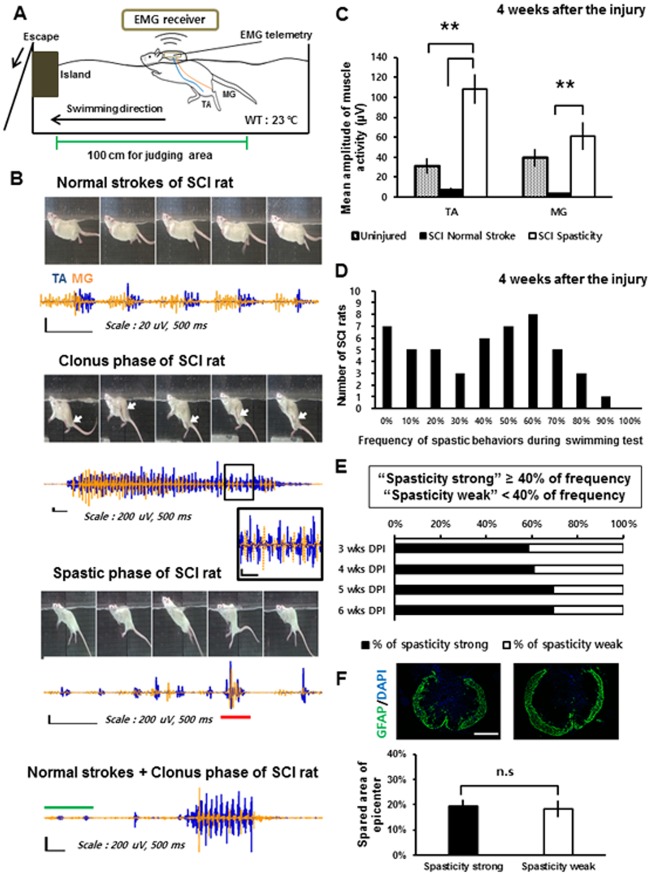
Fig 1. Types and occurrence frequencies of spastic behaviors during the swimming test.
(A) Configuration of the EMG recording device during the swimming test. (B) Sequential captured images and corresponding recorded muscle activity of the left TA (blue) and the left MG (orange) muscle during the swimming test showing each type of spasticity (the clonus phase and spastic phase). The black box represents a magnified image of the recorded EMG. The red bar on the recorded EMG of the spastic phase indicates co-contraction of the TA and MG muscles. The green bar on the bottom image corresponds to the normal reciprocal stroke phase. White arrows indicate the location of the hind paw of the rat during the clonus phase. Note that all EMG figures were normalized to the peak amplitudes of TA muscle activity. (C) Mean amplitude of muscle activity during spastic behaviors (SCI spasticity; black bar) compared with the mean amplitude of muscle activity during normal reciprocal strokes (SCI normal stroke; white bar) of SCI rats and uninjured rats (Uninjured; hatched bar) at 4 weeks after SCI. (D) The number of the SCI rats with each occurrence frequency of spastic behaviors during swimming test at 4weeks after the injury. (E) Percentage of the spasticity-strong rats from 3 to 6 weeks after SCI. Injured rats were classified as “spasticity-strong” if they showed the occurrence frequency over 40% during the swimming test. (F) Average percentage of the spared area of the epicenter of the injury measured by the GFAP (+) area after SCI in the spasticity-strong group and -weak group. **: p < 0.01 Abbreviations: WT, water temperature; TA, tibialis anterior; MG, medial gastrocnemius; n.s, not significant.

