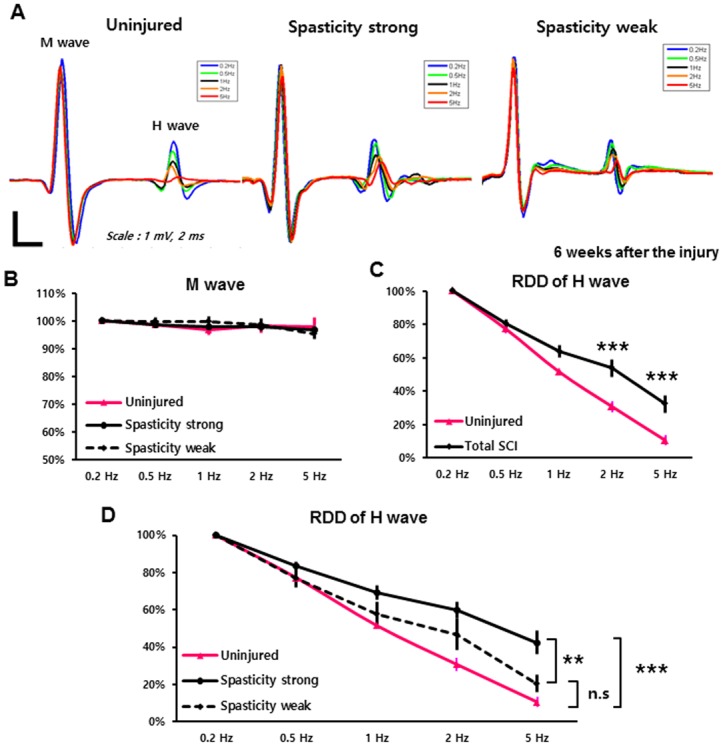
Fig 3. Rate-dependent depression (RDD) of the H-wave in the SCI groups, reflecting excitability of the spinal reflex.

(A) Representative Hoffmann (H) reflex waveforms of uninjured, spasticity-strong, and -weak groups were shown. Different colors indicate different stimulation frequency: 0.2 Hz (blue), 0.5 Hz (Green), 1 Hz (Black), 2 Hz (orange), and 5 Hz (red). (B) RDD of the M-wave. The mean amplitude at 0.2-Hz stimulation was set to the baseline amplitude as 100%. Uninjured (pink), spasticity-strong group (solid line), -weak group (dashed line). (C) RDD of H-wave in the uninjured (pink) and total SCI group (black; includes spasticity-strong and -weak rats). (D) Comparison of the RDD values of the H-wave between groups. The RDD of the spasticity-strong group (solid black line), -weak group (dashed line), and uninjured rats (pink line). **: p < 0.01, ***: p ≤ 0.001.
