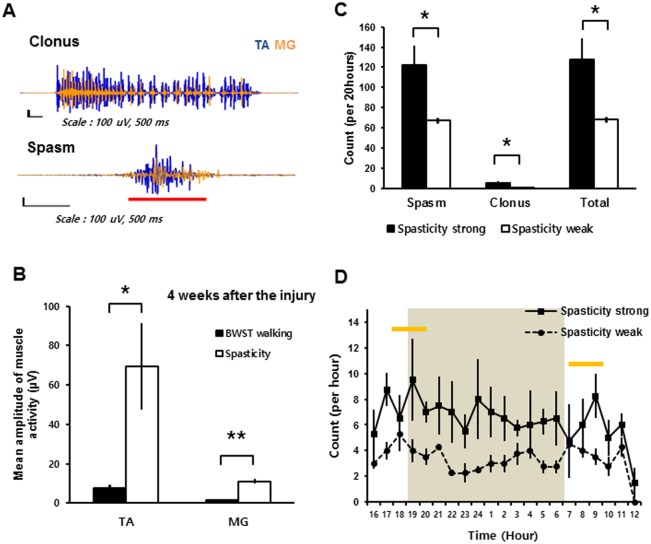
Fig 5. EMG results and occurrence frequencies of spastic behaviors during the 20-hour cage observation.
(A) Recorded EMG results for the clonus and spasm in SCI rat during 20-hour cage observations obtained from the left TA muscle (blue) and the left MG muscle (orange). The red bar indicates co-contraction of the TA and MG muscle activities. Note that all EMG figures were normalized to the peak amplitudes of TA muscle activity. (B) Mean amplitude of muscle activity during spastic behaviors compared with the mean amplitude of muscle activity during 10 gait cycles on BWST 4 weeks after SCI. (C) The occurrence of each type of spastic behaviors during 20-hour cage observations in the spasticity-strong group (solid bars) and -weak group (open bars) at 4 weeks after SCI. (D) The occurrence of spastic behaviors in the spasticity-strong group (solid line) and -weak group (dashed line) shown by each recorded hour. The shaded area shows the default dark time (18:00 to 6:00) of the housing room. The yellow bars indicate the peak time points for the counted spastic behaviors. *: p < 0.05, **: p < 0.01 Abbreviations: TA, tibialis anterior; MG, medial gastrocnemius; BWST, body weight supported Treadmill.

