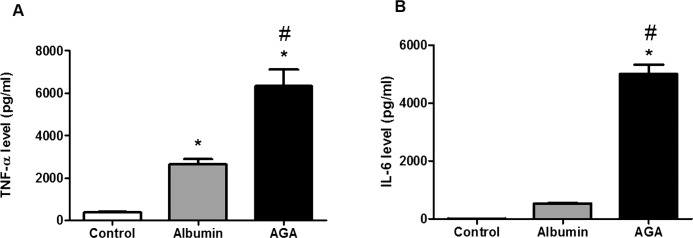
Figure 2.
Tumor necrosis factor-α and IL-6 levels in human macrophages treated with AGA, albumin, or control. (A) Tumor necrosis factor-α level in human macrophages treated with AGA, albumin, or control. There is marked increase in TNF-α level in human macrophages after treatment with AGA compared with albumin or control (*P < 0.05 versus control group, #P < 0.05 versus albumin group; n = 4–5). (B) Interleukin-6 level in human macrophages treated with AGA, albumin, or control. There is marked increase in IL-6 level in human macrophages after treatment with AGA compared with albumin or control (*P < 0.05 versus control group, #P < 0.05 versus albumin group; n = 4).

