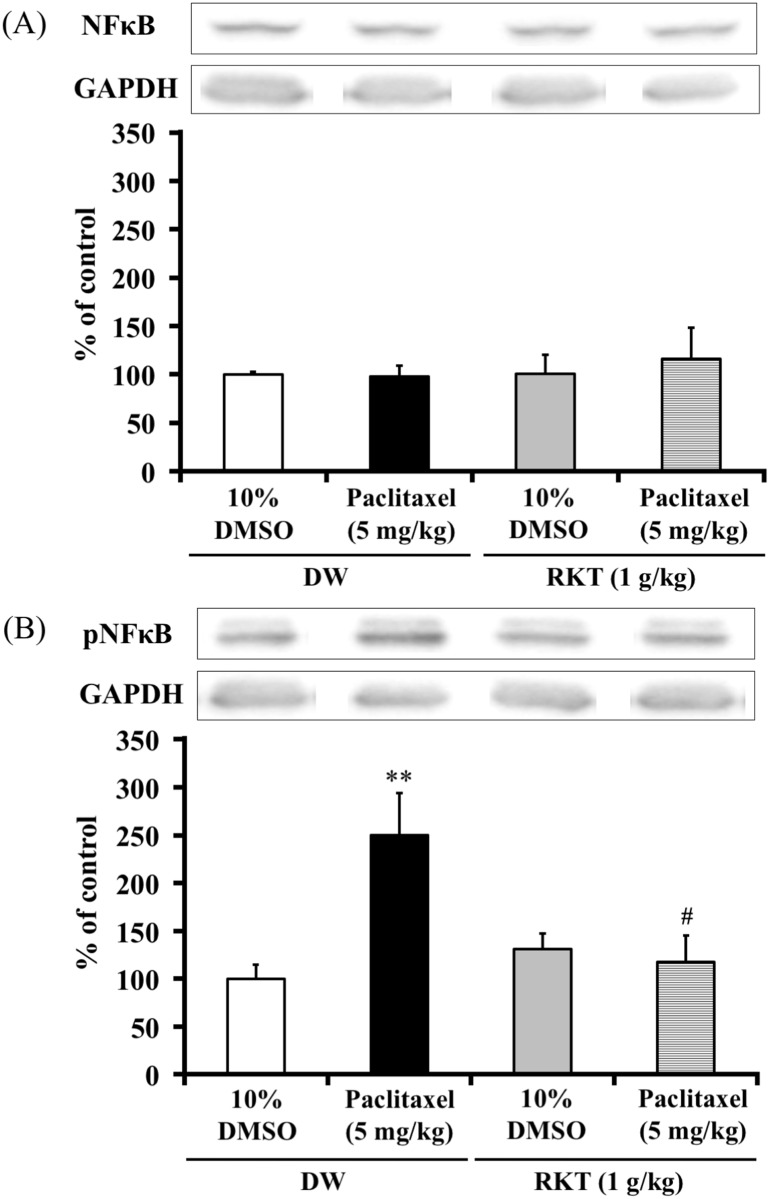
Fig 8. Effect of RKT on the protein levels of spinal NFκB and pNFκB in mice treated with paclitaxel.
Immunoblots of (A) NFκB and (B) pNFκB were normalized by GAPDH. The NFκB column represents the mean ± S.E.M of 5–7 mice. The pNFκB column represents the mean ± S.E.M of 3–5 mice. **P < 0.01 vs. 10%DMSO-DW group. #P < 0.05 vs. paclitaxel-DW group.

