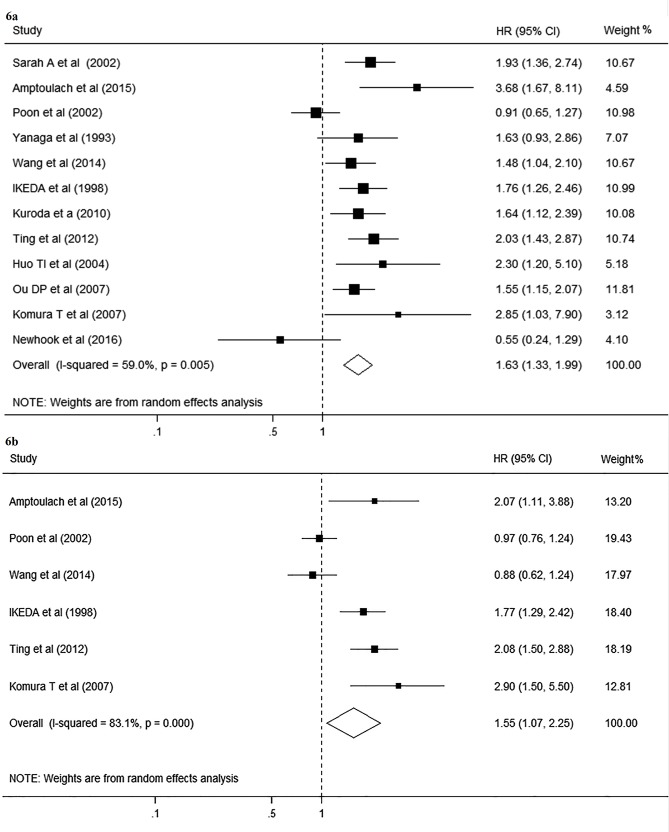
Fig 6. Forest plot on the associations between DM and survival after hepatectomy.
6a, Forest plot on the associations between DM and overall survival after hepatectomy. 6b, Forest plot on the associations between DM and disease-free survival after hepatectomy. DM, diabetes mellitus. The boxes and lines indicate the hazard ratios (HRs) and their confidence intervals (CIs) on a log scale for each study. The pooled HR is represented by a diamond. The size of the black squares indicates the relative weight of each estimate.

