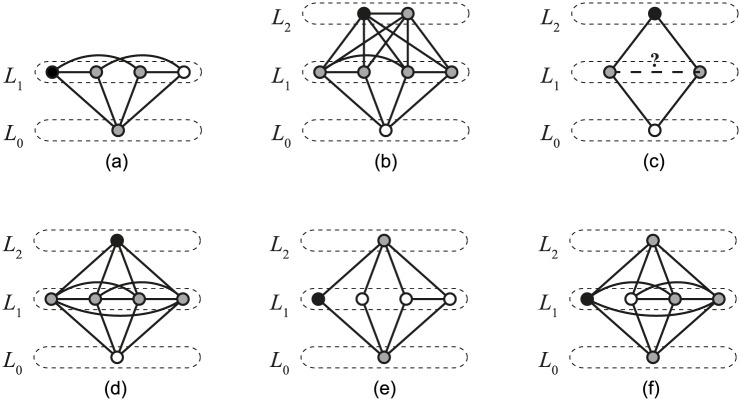
Fig 7. Illustrations of different cases.
Node at the bottom level L0 represents node x. The selected node y is colored black and its neighbours are indicated with a gray color. (a) u = 1. (b) u = 2 ∧ |L2| > 1. (c) u = 2 ∧ |L2| = 1 ∧ k = 4. (d) u = 2 ∧ |L2| = 1 ∧ k ≥ 5 ∧ d(l1) = k − 1. (e) u = 2 ∧ |L2| = 1 ∧ k ≥ 5 ∧ d(l1) < k − 2. (f) u = 2 ∧ |L2| = 1 ∧ k ≥ 5 ∧ d(l1) = k − 2.

