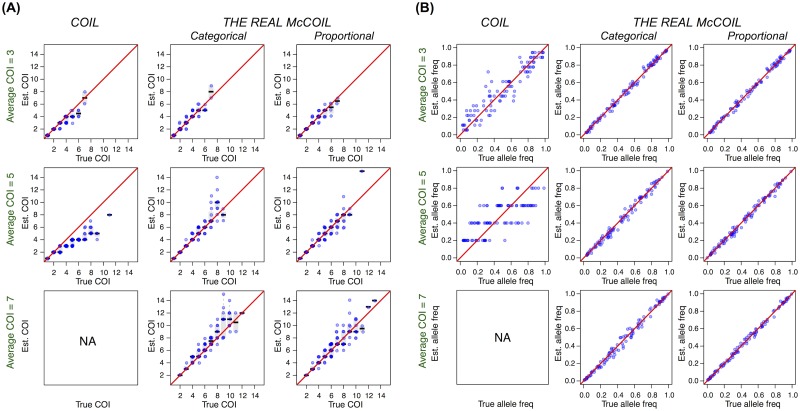
Fig 1. True vs. estimated values of COI (A) and allele frequencies (B) using COIL and THE REAL McCOIL.
Each blue dot represents a sample. The black bar and the grey box show the median and 25% to 75% quantile. THE REAL McCOIL estimated allele frequencies and COI better than COIL, especially when the average COI was high and the majority of infections were polygenomic.

