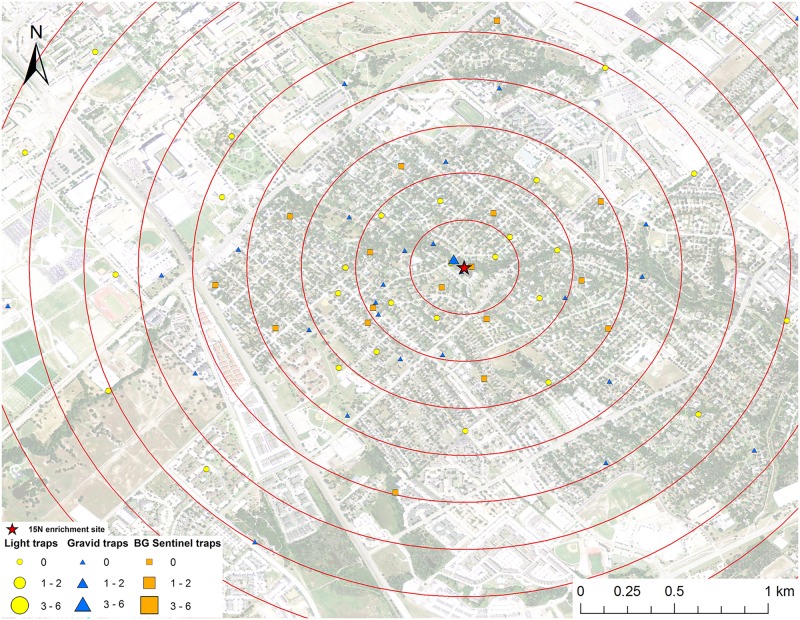
Fig 3. Map of mark-capture study region in College Station, Texas demonstrating the 15N-enrichment site and the spatial distribution of enriched male Cx. quinquefasciatus captures.
Numbers next to symbols in legend represents the number of marked pools captured at each location. The map image was published by the USDA Aerial Photography Field Office as part of the National Agriculture Imagery Program (NAIP), and downloaded as a GIS file. Figure was produced using ArcGIS 10.2 (Esri, Redlands, CA).

