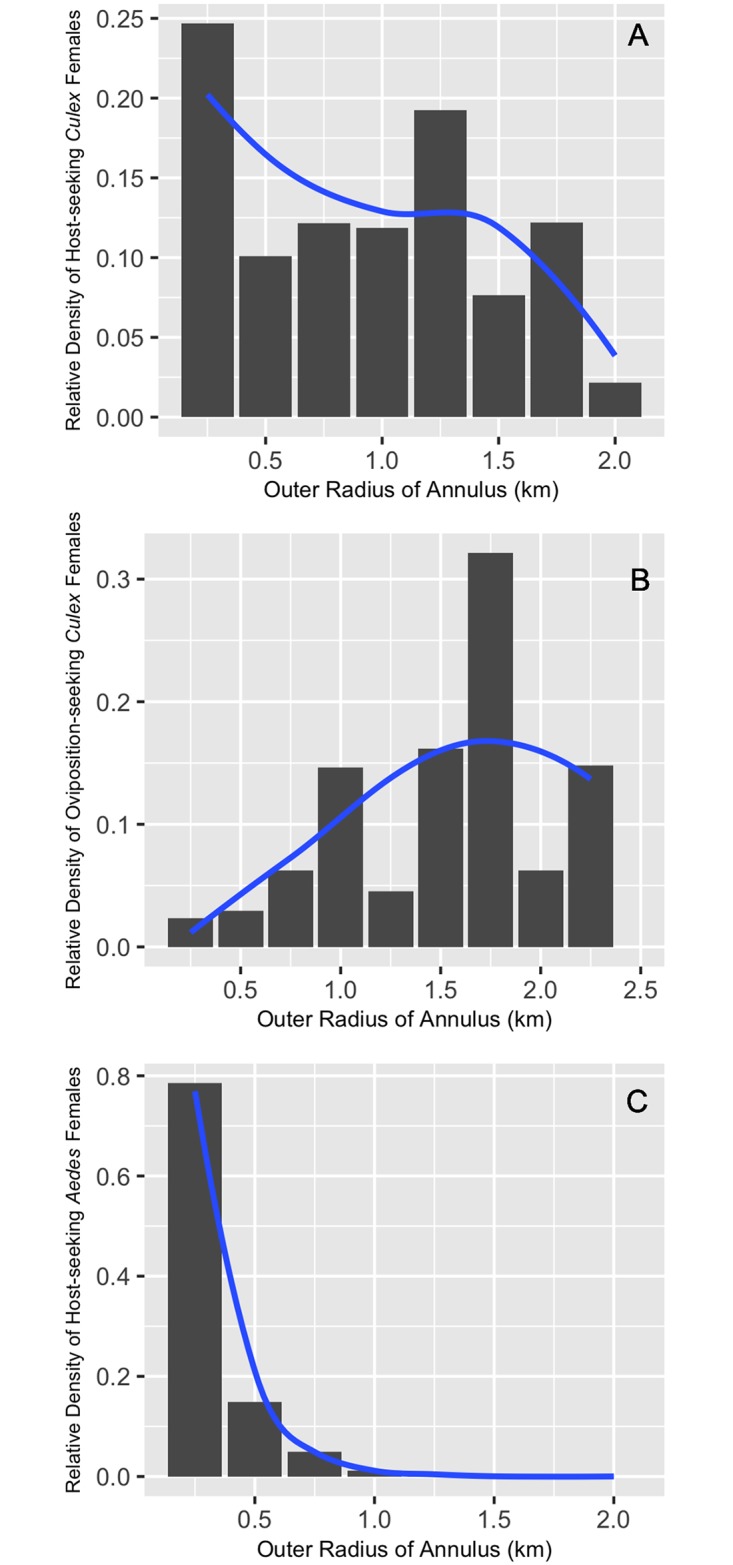
Fig 10. Estimates of the relative density of marked female mosquitoes corrected for trap effort and annulus area for each 250 meter annulus in the analysis.

Blue lines represent approximate average curves for the various estimates of relative density across the annuli. The curve was estimated with the smoother function in ggplot2 (geom_smooth). Subpanels A, B, and C correspond to estimated densities of host-seeking Cx. quinquefasciatus females, oviposition-seeking Cx. quinquefasciatus females, and host-seeking Ae. albopictus females, respectively.
