. 2017 Jan 12;6:e17681. doi: 10.7554/eLife.17681

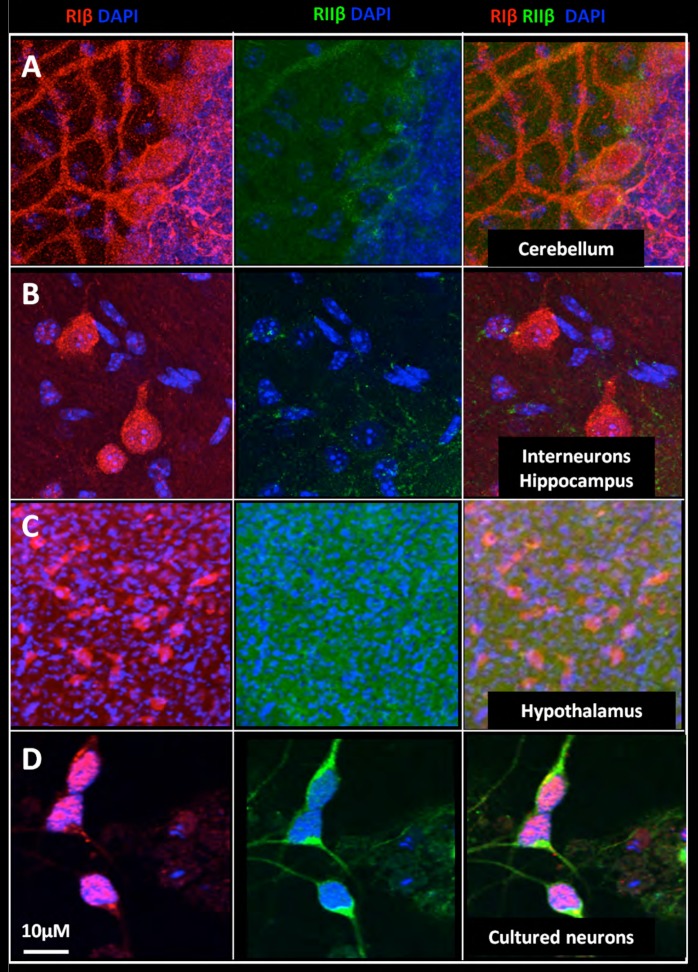
Figure 6. Nuclear localization of RIβ subunit across various brain regions.

Full-resolution views of different brain regions were taken from the mosaic maps or primary cell staining to show the nuclear co-localization. RIβ (red), RIIβ (green) and dapi (blue). One slice of the Z stack is shown (A. Purkinje cells of the cerebellum. (B) Interneurons in the hippocampus. (C) Cells from the thalamus. (D) Cells from the hypothalamus. (E) Primary cortical/hippocampal cells. Scale bar: 10 µm.

DOI: http://dx.doi.org/10.7554/eLife.17681.010

Figure 6.

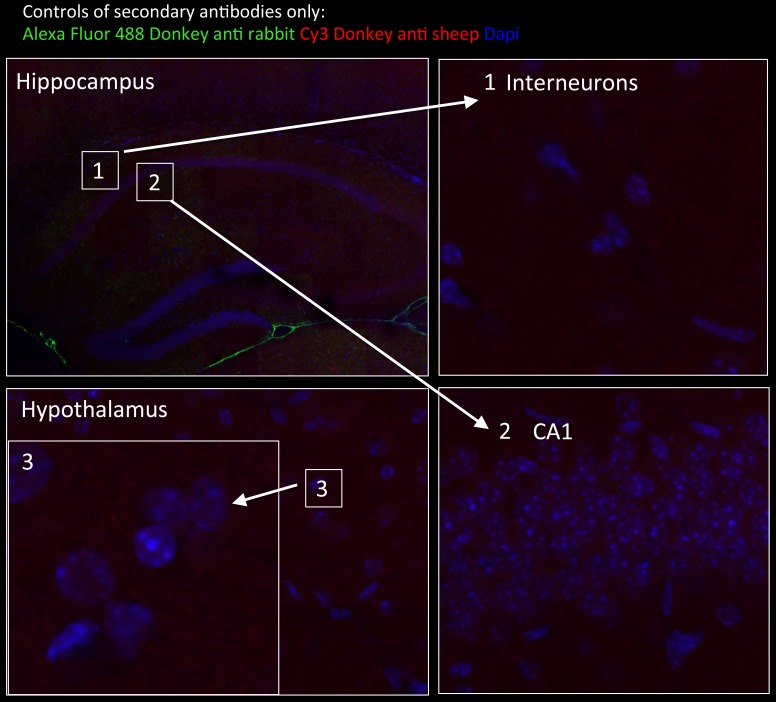
Figure 6—figure supplement 1. Tissue staining with secondary antibodies alone shown as negative controls for brain regions indicated in Figure 6.

Figure 6—figure supplement 1.

Hippocampus in wide-field views stained with Alexa Fluor 488 donkey anti-rabbit (green) and CY3 Donkey anti-sheep (red) including dapi staining (blue). Numbers represent the areas from which higher magnifications were taken: (1) interneuron; (2) neurons from CA1 region; and (3) hypothalamus in wide field view and at higher magnification. No unspecific staining from secondary antibodies was detected.