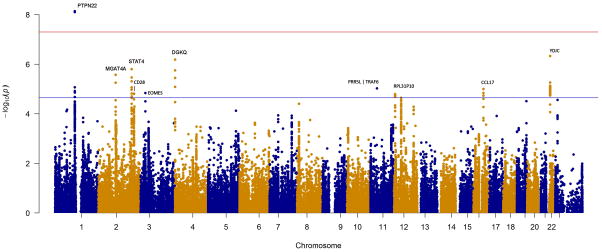
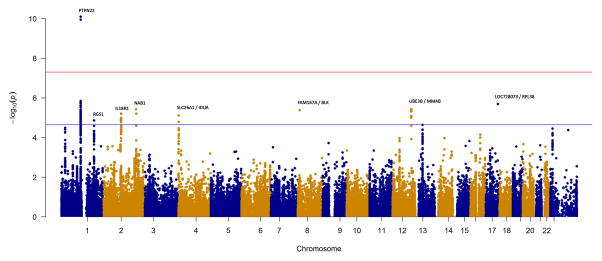
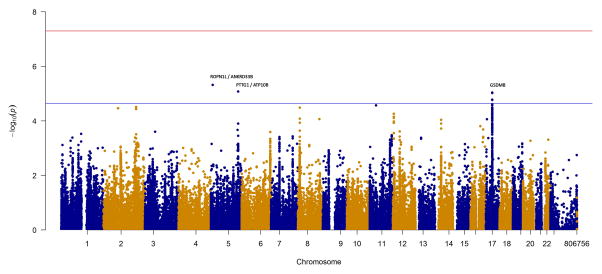
Figure 1. Manhattan plots of the IIM, PM and DM+JDM analyses, with the MHC region removed.
The red and blue lines represent genome-wide level of significance (p=5×10⁻⁸) and suggestive significance (p=2.25×10⁻⁵) respectively. A) Analysis of 2,566 IIM cases and 15,651 controls. B) Analysis of 931PM cases and 15,651 controls. C) Analysis of 1,360 DM+JDM cases and 15,651 controls.


