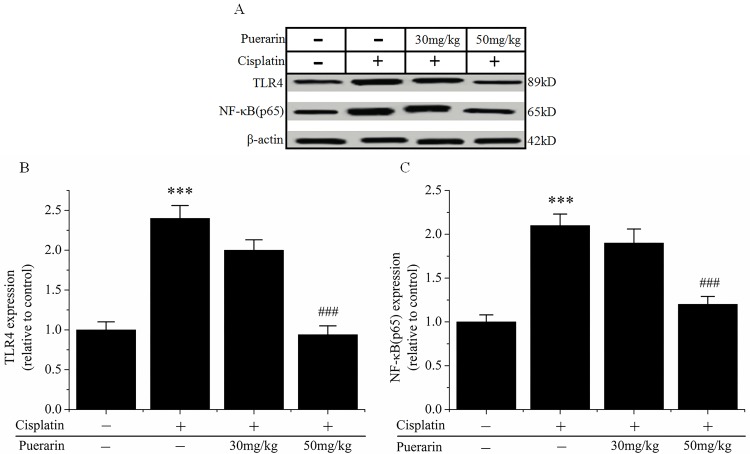
Fig 5. Expression of TLR4 and NF-κB p65 proteins in kidney tissues in each groups.
(A) Representative Western blot picture, showing the expression levels of TLR4 and NF-κB p65 proteins. β-actin was used as an internal control. (B) Changes in the expression level of TLR4 protein. (C) Changes in the expression level of NF-κB p65 protein. Data are presented as mean ± SD (n = 4). ***P<0.05 versus control group; ###P<0.05 versus cisplatin alone treated group.

