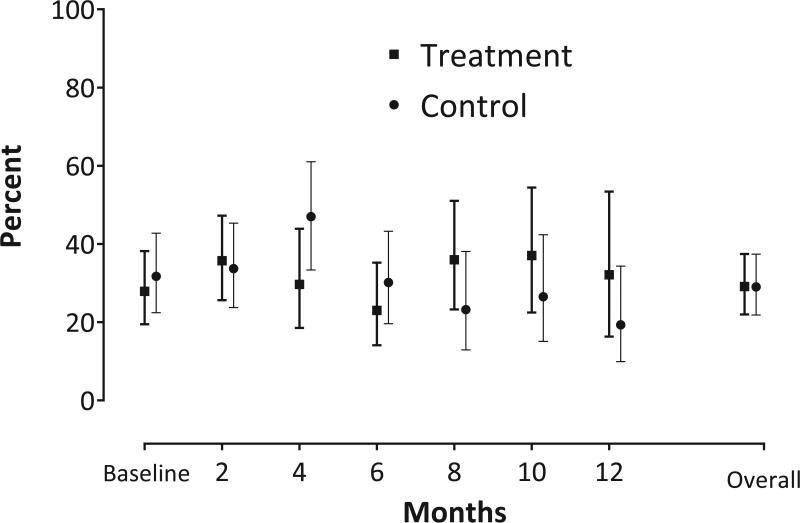
Figure 2.
Bi-monthly and Overall Adjusted Percentages of Bacteriuria Plus Pyuria Specimens by Treatment Status (N=185)a
a Percentage with bacteriuria plus pyuria and corresponding 95% confidence intervals were adjusted for the following pre-specified baseline variables: bacteriuria, incontinence, age at enrollment, and number of comorbidities (see Supplemental Methods Appendix for additional details). The baseline and bi-monthly data represent study participants with bacteriuria plus pyuria while the overall data represent all specimens of bacteriuria plus pyuria over the six follow-up time points (months 2-12). See Total number of participants contributing data at each time point in Table 2.

