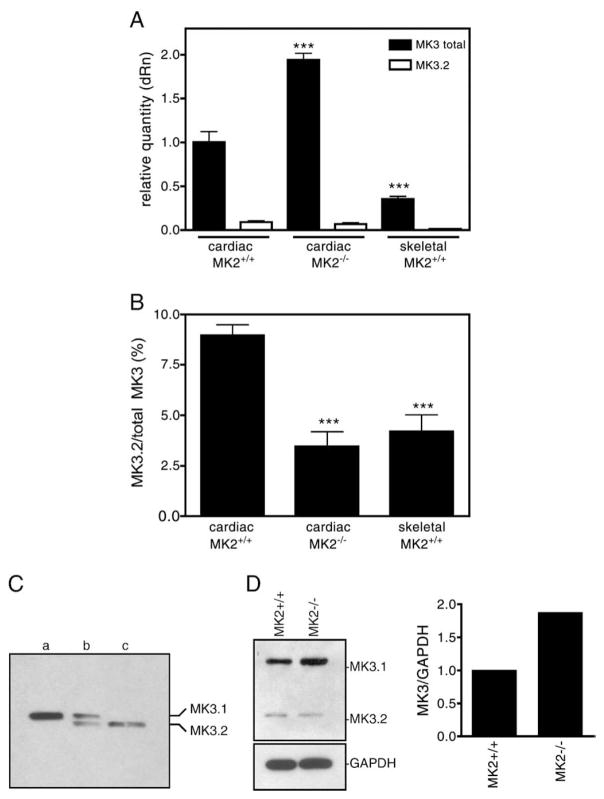
Fig. 2.
Detection of the MK3.1 and MK3.2 in murine ventricular myocardium. (A) The relative expression levels of total MK3 and MK3.2 mRNA were measured in RNA isolated from murine ventricular myocardium (filled bars) or skeletal muscle (open bars) of wild-type (MK2+/+) or MK2−/− mice by qPCR. Values are normalized to the amount of total MK3 transcript in hearts from MK2+/+ litter mates. (B) Abundance of MK3.2 mRNA expressed as percentage of total MK3 mRNA. (C) MK3.1 and MK3.2 protein are detected in mouse heart by immunoblotting. Recombinant GST-MK3.1 (lane a) and GST-MK3.2 (lane c), treated with thrombin to remove the GST moiety, were electrophoresed alongside 100 μg of lysate prepared from mouse ventricular myocardium (lane b). (D) Detection of MK3 protein in lysates from MK2−/− hearts and MK2+/+ litter mates by immunoblotting. Shown on the right, immunoreactive bands were quantified and normalized to GAPDH content. qPCR data are the mean and S.E. (n=8–10). ***, p<0.001 vs. total MK3 in MK2+/+ hearts (A) or MK3.2/total MK3 in MK2+/+ hearts (B); one-way ANOVA with Newman–Keuls post-hoc analysis.

