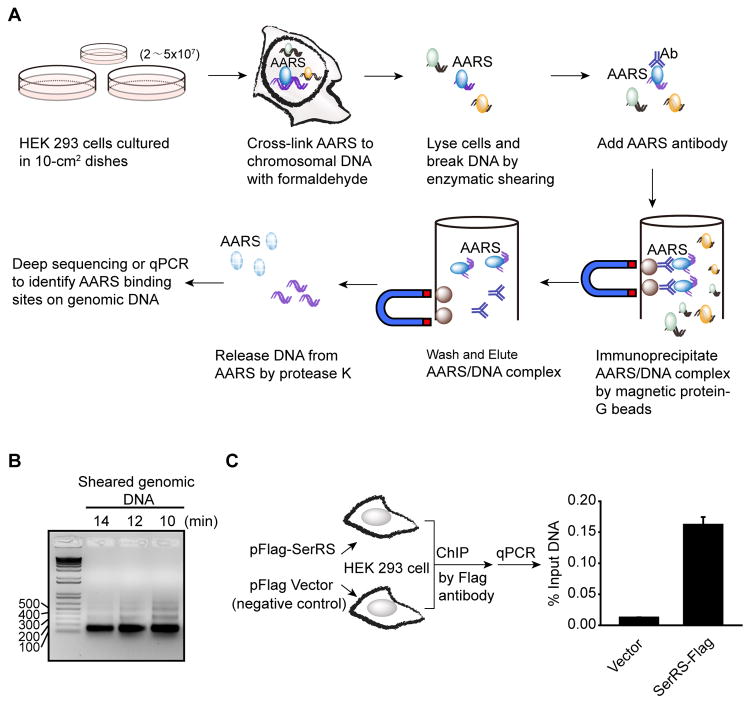
Figure 4.
ChIP assay to identify AARS binding loci on genomic DNA. (A) Schematic representation of the ChIP procedure. (B) Agarose gel analysis to monitor enzymatic shearing results at various time points. Optimal shearing should give bands between 150 bp to 500 bp with a predominant band at 150 bp. In this experiment with HEK 293 cells, 10–12 minutes of enzymatic shearing was optimal. (C) Enrichment of VEGFA promoter DNA from HEK 293 cells overexpressing Flag-tagged SerRS versus the empty vector by ChIP assay using a Flag antibody. Quantitative real-time PCR (qPCR) was performed using DNA purified from the ChIP reactions and a primer pair specific for the VEGFA gene.

