Fig. 5.

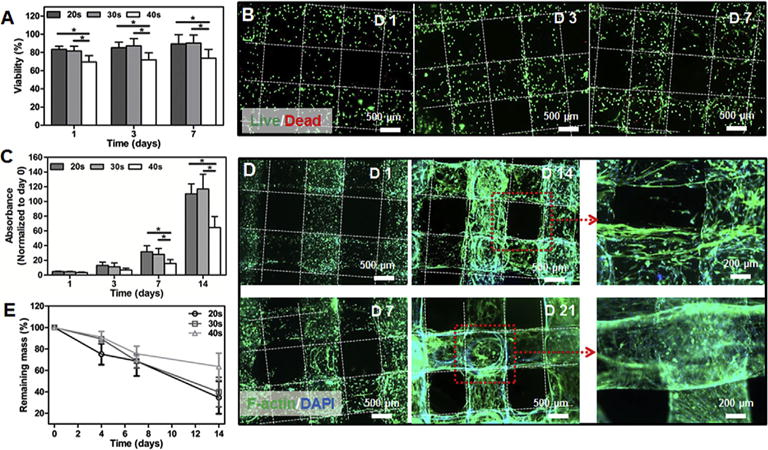
(A) Quantitative analysis of viable cells with different UV crosslinking times. (B) Fluorescence micrographs of Live/Dead staining after 1, 3, and 7 days of culture for the bioprinted tubes encapsulating vascular cells (6.9 mW cm−2 UV light for 30 s). (C) Measurement of cell metabolic activities of the bioprinted tubes under different UV crosslinking times. (D) Fluorescence micrographs showing f-actin/nuclei staining for the bioprinted constructs at 1, 7, 14, and 21 days of culture (6.9 mW cm−2 UV light for 30 s). (E) Degradation profiles of the bioprinted constructs at different UV crosslinking times. (n = 6; *p < 0.05).
