
Figure 2.
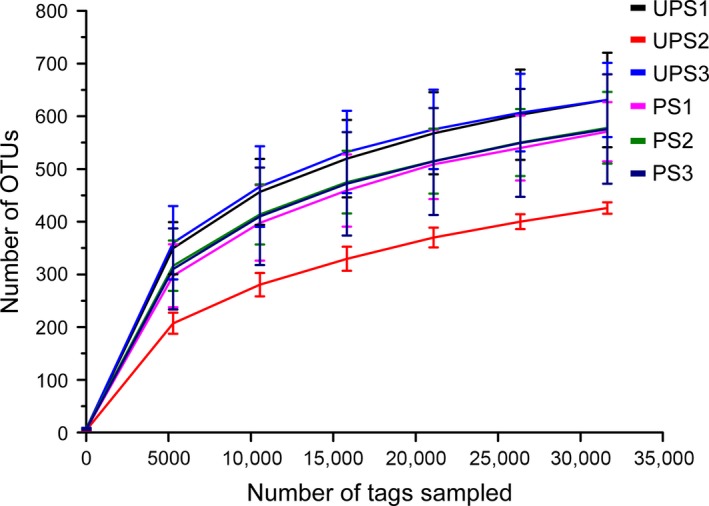
Rarefaction curves of the OTU number at 97% similarity for each sample. Average value of three replicates and error bar are shown. UPS, unpolluted sites; PS, polluted sites.
Official websites use .gov
A
.gov website belongs to an official
government organization in the United States.
Secure .gov websites use HTTPS
A lock (
) or https:// means you've safely
connected to the .gov website. Share sensitive
information only on official, secure websites.
Rarefaction curves of the OTU number at 97% similarity for each sample. Average value of three replicates and error bar are shown. UPS, unpolluted sites; PS, polluted sites.